All published articles of this journal are available on ScienceDirect.

Trajectories of Fear of Falling and Associated Factors among Stroke Patients
Abstract
Introduction
To explore latent classes and developmental trajectories of fear of falling (FOF) within 1 to 6 months after stroke onset and to examine factors associated with latent class membership.
Methods
Through convenience sampling, 203 stroke patients receiving rehabilitation treatment at the Neurology Department in Hebei Province were recruited between May 2023 and December 2023. Data were collected at 1, 2, 3, 4, and 6 months after stroke onset using a general questionnaire and the Falls Efficacy Scale International (FES-I). Growth Mixture Modeling (GMM) was used to explore the latent classes and corresponding development trajectories of FOF. Univariate analysis and logistic regression were used to examine factors associated with latent class membership.
Results
The model fit results showed that a two-class latent-basis growth mixture model (allowing non-linear change over time) was the optimal model. The Class 1 (60.0%) was characterized by a higher initial level of FOF followed by a gradual decline over time, whereas the Class 2 (40.0%) showed a relatively lower initial level of FOF with a gradual increase over time. The logistic regression analysis indicated that education level, fall history, type of stroke, and any chronic illness were independently associated with latent class membership.
Discussion
The two distinct trajectories of FOF suggest that FOF changes dynamically among stroke patients during recovery. Patients with elementary school education or below, prior falls, hemorrhagic stroke, and three or more chronic illnesses were more likely to belong to the lower-FOF increasing group, comprising 40% of the sample.
Conclusion
These findings highlight the importance of early recognition of patients who may be more likely to follow an increasing FOF trajectory and may inform more attentive and individualized rehabilitation planning.
1. INTRODUCTION
Stroke is a neurological disorder caused by interruption of cerebral blood supply due to ischemic or hemorrhagic events, resulting in acute neurological dysfunction [1]. According to the Global Burden of Disease Study 2021, stroke remains a major global health concern and was the second leading cause of death worldwide in 2021, accounting for approximately 7.3 million deaths and more than 160 million disability-adjusted life years. The global burden of stroke has increased substantially since 1990, with a disproportionate impact on low- and middle-income countries [2]. In these settings, stroke often occurs at a younger age, contributing to productivity loss and increased healthcare costs. One survey reported that 25% of previously employed stroke survivors left work or reduced workload after stroke [3]. With advances in acute stroke care and rehabilitation, the number of stroke survivors has increased in recent years.
Stroke often results in weakness on one side of the body, making stroke survivors feel uncoordinated and unsteady. Thus, falling is a common issue among stroke survivors. Based on research studies, stroke survivors have 14% risk of falling in the first month and over 30% risk of falling within ten years [4]. Falls can result in physical injury, emotional distress, activity restriction, and greater dependence [5], which may further contribute to social isolation and poorer quality of life. Thus, many survivors have “fear of falling (FOF)”, defined as concern about falling during daily activities [6]. According to a survey, about half of stroke survivors have FOF, which may further restrict activity participation and social engagement [7].
Most research on FOF in stroke has used cross-sectional designs, and longitudinal evidence remains limited. Previous studies suggest that FOF is dynamic and may vary across stages of recovery [8, 9]. In some individuals, FOF may fluctuate early and then stabilize or improve during rehabilitation [10, 11]. Given substantial heterogeneity in functional recovery, impairment severity, comorbidity burden, and social support, stroke survivors may follow distinct patterns of change in FOF over time. Some individuals may regain mobility and confidence, whereas others may experience persistent or increasing concern about falling. These considerations support the existence of clinically meaningful subgroups with distinct developmental trajectories of FOF. Traditional growth models estimate an average trajectory and assume population homogeneity [12], which may obscure important subgroup differences. Growth mixture modeling (GMM) can identify latent classes characterized by distinct longitudinal trajectories [13]. Therefore, this study applied GMM to identify latent classes of FOF within 1 to 6 months after stroke onset and to examine factors associated with latent class membership.
2. METHODS
2.1. Participants and Sample
Using convenience sampling, stroke patients receiving rehabilitation treatment at the Neurology Department of Chengde Central Hospital in Hebei Province were recruited between May 2023 and December 2023. Inclusion criteria were a confirmed diagnosis of stroke by CT or MRI, first-ever stroke, ability to communicate verbally, and provision of informed consent. Exclusion criteria were concurrent severe diseases, diagnosed mental disorders, and participation in other studies. Methodological literature indicates that sample size requirements for GMM depend on model complexity and class separation, and that samples of approximately 200 or more have been reported to be adequate under certain conditions. Allowing for an anticipated 15% attrition and non-response rate, the target sample size was set at 235. Of 235 eligible patients approached, 20 declined participation, and 12 withdrew during follow-up. Ultimately, 203 participants completed all scheduled assessments and were included in the final analysis. Among completers, no missing data were observed for baseline variables or repeated FES-I measurements. Therefore, trajectory analyses and subsequent regression analyses were performed using complete cases.
2.2. Measurements
The general questionnaire was developed by the research team. The contents included gender, age, education level, marital status, fall history, type of stroke, paralysis side, and the number of physician-diagnosed chronic illnesses documented in patients’ medical records. The comorbidity variable was categorized as ≤2 versus ≥3, as previous literature suggests that three chronic illnesses represent a meaningful threshold [14]. The selection of these variables was informed by prior literature and was considered in relation to the fear-avoidance framework described by Hadjistavropoulos et al. (2011), which conceptualizes FOF as a multidimensional construct involving cognitive, behavioral, and physiological components [15]. In this study, analyses were limited to demographic and clinical factors, and the central psychological constructs proposed in the fear-avoidance framework were not measured. Demographic factors (e.g., gender, age, education level, and marital status) and clinical factors (e.g., fall history, stroke type, paralysis side, and chronic illnesses) have been reported to be associated with FOF in previous studies.
The Falls Efficacy Scale International (FES-I) is one of the most widely used instruments for assessing FOF. Developed as a revision of the original Falls Efficacy Scale in 2005, the FES-I has demonstrated validity and applicability in people with stroke [16]. The scale comprises 16 items that assess the level of concern about falling across a range of activities, from basic daily tasks to more demanding activities requiring physical or social engagement. Each item is rated on a 4-point Likert scale (“not at all concerned”, “somewhat concerned”, “fairly concerned”, and “very concerned”), with scores ranging from 1 to 4. Total scores range from 16 to 64, with higher scores indicating greater FOF. The FES-I has demonstrated high internal consistency, with a Cronbach’s alpha coefficient of 0.905, indicating excellent reliability [17]. Test-retest reliability was also high, with an intraclass correlation coefficient (ICC) of 0.99, indicating stability over time [17].
2.3. Data Collection
Participants completed face-to-face questionnaire surveys in a quiet setting at 1, 2, 3, 4, and 6 months after stroke onset. Data were collected by trained researchers who received standardized training in study procedures, questionnaire administration, and neutral communication techniques to avoid leading or suggestive prompts. Before administration, participants were informed about the purpose, content, and significance of the survey, and written informed consent was obtained. The questionnaires required approximately 8-15 minutes to complete. After completion, questionnaires were checked for missing responses, and participants were asked to complete any missing items. To minimize loss to follow-up, small tokens of appreciation were provided after each assessment. Data were entered into SPSS 27.0 by two independent operators, and a double-entry verification procedure was used to ensure data accuracy.
2.4. Data Analysis
GMM was performed using Mplus 8.2. The GMM included intercept and slope factors, with each factor having two parameters, a mean and a variance. The parameter interpretations are as follows: the mean of the intercept and slope represents the average initial level of FOF and the average rate of change, respectively; the variances of the intercept and slope represent individual differences in initial levels and rates of change, respectively. Factor variances were constrained to be equal across classes. Models were estimated using maximum likelihood estimation with robust standard errors (MLR). To reduce the likelihood of local maxima, 200 random sets of starting values with 10 final-stage optimizations were used. Convergence was confirmed when the best log-likelihood value was replicated. In addition to linear and quadratic models, a latent-basis growth mixture model was examined. In this model, time scores for the slope factor were estimated using a latent-basis specification, with intermediate factor loadings freely estimated to accommodate nonlinear patterns of change.
Model fit indices included the Akaike Information Criterion (AIC), Bayesian Information Criterion (BIC), and the sample size-adjusted BIC (aBIC), with smaller values indicating better model fit. Model classification precision was assessed using entropy, which ranges from 0 to 1, with values closer to 1 indicating higher accuracy. An entropy value of 0.80 suggests that the classification accuracy rate exceeds 90%. Differences between k-1 and k classes were compared using the Lo-Mendell-Rubin Likelihood Ratio Test (LMR) and the Bootstrapped Likelihood Ratio Test (BLRT), with p<0.05 denoting that the k-class model is superior to the (k−1)-class model. A minimum class size of 5% was required. Model selection was guided by statistical fit indices in conjunction with substantive and clinical interpretability.
Descriptive and inferential statistical analyses were performed using SPSS 27.0. Nominal/ordinal data were described using frequencies. Logistic regression analysis was conducted using the latent class membership as the dependent variable and demographic and clinical variables as independent variables. A two-tailed p<0.05 was considered statistically significant.
The Sex and Gender Equity in Research (SAGER) Guidelines were followed by the authors.
3. RESULTS
3.1. Latent Classes and Corresponding Development Trajectories of FOF
In the study, FOF scores at 1, 2, 3, 4, and 6 months post-stroke onset were used as repeated measures. The model was specified as a GMM, and 1- to 4-class models were estimated for the linear growth model, the latent-basis growth mixture model, and the quadratic function model. For the linear growth model, the LMR test was not statistically significant for the 3-class and 4-class models but was statistically significant for the 2-class model. For the latent-basis growth mixture model, the LMR test was not statistically significant for the 3-class and 4-class models but was statistically significant for the 2-class model. For the quadratic function model, the LMR test was not statistically significant for the 2-class, 3-class, or 4-class models. In both the linear growth model and the latent-basis growth mixture model, the AIC, BIC, and aBIC values for the 2-class model were lower than those for the 1-class model. When comparing the 2-class linear growth model with the 2-class latent-basis growth mixture model, the two models had the same entropy value of 0.996, and both the LMR and BLRT tests were statistically significant. The AIC, BIC, and aBIC values for the 2-class latent-basis growth mixture model were lower than those for the 2-class linear growth model; therefore, the 2-class latent-basis growth mixture model was selected as the optimal model. The model fit results for each model are presented in Table 1.
| Model | AIC | BIC | aBIC | Entropy | LMR | BLRT | |
|---|---|---|---|---|---|---|---|
| Linear growth model | - | - | - | - | - | - | |
| 1-class | 5135.824 | 5168.956 | 5137.273 | - | - | - | |
| 2-class | 4941.794 | 4984.866 | 4943.679 | 0.996 | 0.0031 | <0.0001 | |
| 3-class | 4891.802 | 4944.813 | 4894.121 | 0.938 | 0.4722 | <0.0001 | |
| 4-class | 4855.448 | 4918.399 | 4858.202 | 0.963 | 0.0926 | <0.0001 | |
| Latent-basis growth mixture model | - | - | - | - | - | - | |
| 1-class | 5103.126 | 5146.198 | 5105.010 | - | - | - | |
| 2-class | 4904.826 | 4957.837 | 4907.145 | 0.996 | 0.0001 | <0.0001 | |
| 3-class | 4857.406 | 4920.357 | 4860.160 | 0.935 | 0.4862 | <0.0001 | |
| 4-class | 4821.438 | 4894.328 | 4824.627 | 0.962 | 0.0740 | <0.0001 | |
| Quadratic function model | - | - | - | - | - | - | |
| 1-class | 5074.337 | 5120.722 | 5076.366 | - | - | - | |
| 2-class | 4881.616 | 4941.253 | 4884.225 | 0.996 | 0.0596 | <0.0001 | |
| 3-class | 4834.003 | 4906.893 | 4837.192 | 0.934 | 0.5740 | <0.0001 | |
| 4-class | 4767.710 | 4853.854 | 4771.479 | 0.963 | 0.3769 | <0.0001 | |
Based on the optimal model, two latent classes were identified. In Class 1, the estimated intercept mean was 59.97 (p < 0.001), and the slope mean was -2.61 (p < 0.001), indicating a higher initial FOF level followed by a gradual decline over time. This class was labeled the “higher-FOF declining group” and accounted for 60.0% of participants. In Class 2, the estimated intercept mean was 48.95 (p < 0.001), and the slope mean was 1.74 (p < 0.001), indicating a relatively low initial FOF with a gradual increase over time. This class was labeled the “lower-FOF increasing group” and comprised 40.0% of the sample. Previous research has estimated the minimal clinically important difference (MCID) for the FES-I to be approximately 5.5 points using distribution-based methods [18]. In the present study, the baseline difference between the two classes was approximately 11 points, nearly twice the reported MCID. This difference is likely to be clinically meaningful rather than a minor statistical variation. The variances of the intercept and slope factors were constrained to be equal across classes to ensure model stability and parsimony. The developmental trajectories of FOF are presented in Fig. (1), and parameter estimates are reported in Table 2.
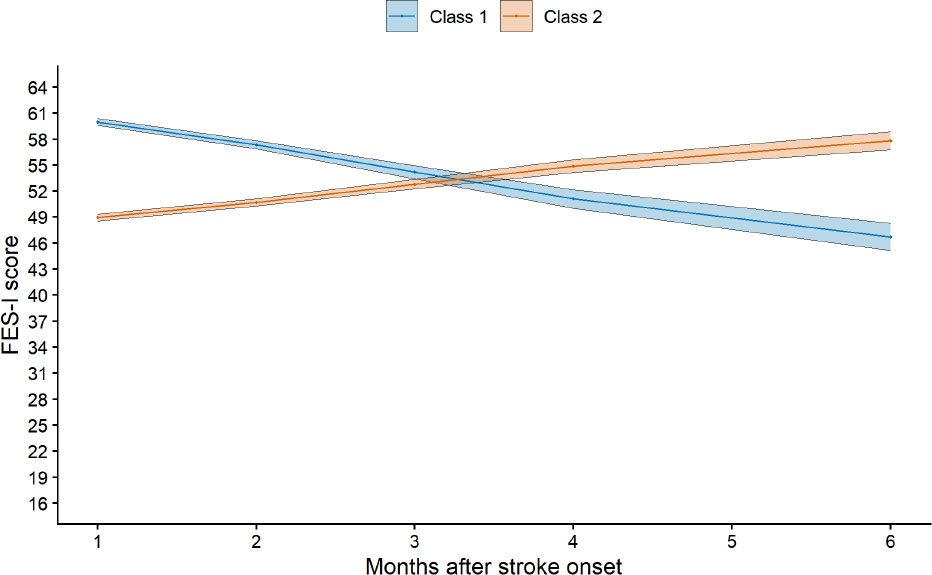
Development trajectories of fear of falling based on the 2-class latent-basis growth mixture model.
Note: FES-I refers to the falls efficacy scale international, and the x-axis represents months after stroke onset (1, 2, 3, 4, and 6 months). Solid lines indicate the class means trajectories, and shaded areas represent 95% confidence intervals. Individual trajectories were removed.
| Parameter | Estimate | SE | t | p | 95%CI Lower | 95%CI Upper |
|---|---|---|---|---|---|---|
| Latent Class 1 | - | - | - | - | - | - |
| Mean | - | - | - | - | - | - |
| Intercept | 59.966 | 0.229 | 261.399 | <0.0001 | 59.516 | 60.416 |
| Slope | -2.607 | 0.265 | -9.852 | <0.0001 | -3.126 | -2.088 |
| Variance | - | - | - | - | - | - |
| Intercept | 2.896 | 0.411 | 7.055 | <0.0001 | 2.092 | 3.701 |
| Slope | 1.540 | 0.363 | 4.242 | <0.0001 | 0.828 | 2.251 |
| Latent Class 2 | - | - | - | - | - | - |
| Mean | - | - | - | - | - | - |
| Intercept | 48.949 | 0.243 | 201.718 | <0.0001 | 48.473 | 49.424 |
| Slope | 1.742 | 0.232 | 7.520 | <0.0001 | 1.288 | 2.196 |
| Variance | - | - | - | - | - | - |
| Intercept | 2.896 | 0.411 | 7.055 | <0.0001 | 2.092 | 3.701 |
| Slope | 1.540 | 0.363 | 4.242 | <0.0001 | 0.828 | 2.251 |
3.2. Comparison of Completers and Non-completers
Available baseline characteristics were compared between completers and non-completers to assess potential attrition bias. No statistically significant differences were observed between the two groups. Detailed results are presented in Table 3.
| Variable | Completers (n = 203) | Non-completers (n = 32) | Test Statistic | p-value |
|---|---|---|---|---|
| Gender | - | - | 1.182a | 0.277 |
| Female | 84 (41.4) | 10 (31.2) | - | - |
| Male | 119 (58.6) | 22 (68.8) | - | - |
| Age | 64.69 ± 6.73 | 65.53 ± 5.61 | -0.671b | 0.503 |
| Education level | - | - | 0.334a | 0.846 |
| Elementary school or less | 78 (38.4) | 11 (34.4) | - | - |
| Middle school | 94 (46.3) | 15 (46.9) | - | - |
| Junior college and above | 31 (15.3) | 6 (18.7) | - | - |
| Marital status | - | - | 1.295a | 0.523 |
| Married | 135 (66.5) | 18 (56.2) | - | - |
| Divorced | 28 (13.8) | 6 (18.8) | - | - |
| Widowed | 40 (19.7) | 8 (25.0) | - | - |
| Fall history | - | - | 2.718a | 0.099 |
| Yes | 43 (21.2) | 11 (34.4) | - | - |
| No | 160 (78.8) | 21 (65.6) | - | - |
| Type of stroke | - | - | 0.554a | 0.457 |
| Ischemic | 139 (68.5) | 24 (75.0) | - | - |
| Hemorrhagic | 64 (31.5) | 8 (25.0) | - | - |
| Paralysis side | - | - | 0.180a | 0.671 |
| Left | 97 (47.8) | 14 (43.8) | - | - |
| Right | 106 (52.2) | 18 (56.2) | - | - |
| Any chronic illness | - | - | 0.300a | 0.584 |
| ≤2 | 110 (54.2) | 19 (59.4) | - | - |
| ≥3 | 93 (45.8) | 13 (40.6) | - | - |
3.3. Factors Associated with Latent Class Membership
The results of the univariate analysis indicated statistically significant differences between the “higher-FOF declining group” and the “lower-FOF increasing group” in terms of education level, fall history, type of stroke, and any chronic illness (p < 0.05), as shown in Table 4. For the logistic regression analysis, latent class membership of FOF was the dependent variable. Covariates were selected based on both univariate findings and prior literature. Age, gender, and paralysis side were retained as potential confounders regardless of univariate statistical significance. The higher-FOF declining group was coded as 0, and the lower-FOF increasing group was coded as 1, with the first category used as the reference for each independent variable. The Hosmer-Lemeshow goodness-of-fit test was not significant (χ2 = 10.425, df = 8, p = 0.236), indicating an adequate model fit. It is generally accepted that a tolerance value below 0.1 or a variance inflation factor (VIF) greater than 10 indicates multicollinearity [19]. The tolerance values ranged from 0.409 to 0.699, and the VIF values ranged from 1.431 to 2.447, indicating no evidence of multicollinearity.
| Variable |
Higher-FOF Declining Group n (%)/Mean±SD |
Lower-FOF Increasing Group n (%)/Mean±SD |
Test Statistic | p-value |
|---|---|---|---|---|
| Gender | - | - | 0.537a | 0.464 |
| Female | 53 (43.4) | 31 (38.3) | - | - |
| Male | 69 (56.6) | 50 (61.7) | - | - |
| Age | 64.07 ± 5.36 | 65.62 ± 8.33 | -1.477b | 0.142 |
| Education level | - | - | 21.638a | <0.0001 |
| Elementary school or less | 32 (26.2) | 46 (56.8) | - | - |
| Middle school | 64 (52.5) | 30 (37.0) | - | - |
| Junior college and above | 26 (21.3) | 5 (6.2) | - | - |
| Marital status | - | - | 5.555a | 0.062 |
| Married | 84 (68.9) | 51 (63.0) | - | - |
| Divorced | 20 (16.4) | 8 (9.9) | - | - |
| Widowed | 18 (14.8) | 22 (27.2) | - | - |
| Fall history | - | - | 14.464a | <0.0001 |
| Yes | 15 (12.3) | 28 (34.6) | - | - |
| No | 107 (87.7) | 53 (65.4) | - | - |
| Type of stroke | - | - | 29.019a | <0.0001 |
| Ischemic | 101 (82.8) | 38 (46.9) | - | - |
| Hemorrhagic | 21 (17.2) | 43 (53.1) | - | - |
| Paralysis side | - | - | 0.434a | 0.510 |
| Left | 56 (45.9) | 41 (50.6) | - | - |
| Right | 66 (54.1) | 40 (49.4) | - | - |
| Any chronic illness | - | - | 32.742a | <0.0001 |
| ≤2 | 86 (70.5) | 24 (29.6) | - | - |
| ≥3 | 36 (29.5) | 57 (70.4) | - | - |
The logistic regression analysis showed that education level, fall history, type of stroke, and any chronic illness were independently associated with the latent class membership. Compared with elementary school education or less, participants with a middle school education had lower odds of belonging to the increasing group (OR = 0.126, p = 0.029), whereas junior college education and above was not significant (p = 0.209). Compared with participants with a fall history, those without a fall history had lower odds of belonging to the increasing group (OR = 0.037, 95% CI: 0.007 - 0.201, p < 0.001). Given the large effect size and narrow confidence interval, we further examined whether this finding might be a consequence of near-perfect separation in the logistic regression model. No quasi-complete separation was observed. Participants with hemorrhagic stroke had higher odds of belonging to the increasing group than those with ischemic stroke (OR = 3.171, p = 0.048), and participants with three or more chronic illnesses had higher odds of belonging to the increasing group than those with two or fewer (OR = 2.988, p = 0.016). Detailed results are presented in Table 5.
| Variable | B | SE | Wald χ2 | p | OR | 95%CI Lower | 95%CI Upper |
|---|---|---|---|---|---|---|---|
| Constant | 5.288 | 3.078 | 2.951 | 0.086 | - | - | - |
| Gender | 0.492 | 0.695 | 0.501 | 0.479 | 1.636 | 0.419 | 6.392 |
| Age | -0.017 | 0.034 | 0.265 | 0.607 | 0.983 | 0.919 | 1.050 |
| Education level | - | - | - | - | - | - | - |
| Middle school | -2.075 | 0.948 | 4.789 | 0.029 | 0.126 | 0.020 | 0.805 |
| Junior college and above | -1.011 | 0.805 | 1.578 | 0.209 | 0.364 | 0.075 | 1.762 |
| Fall history | -3.298 | 0.864 | 14.559 | <0.001 | 0.037 | 0.007 | 0.201 |
| Type of stroke | 1.154 | 0.584 | 3.900 | 0.048 | 3.171 | 1.009 | 9.967 |
| Paralysis side | -1.199 | 0.664 | 3.256 | 0.071 | 0.302 | 0.082 | 1.109 |
| Any chronic illness | 1.095 | 0.455 | 5.776 | 0.016 | 2.988 | 1.224 | 7.296 |
4. DISCUSSION
The dynamic nature of FOF has been discussed, describing it as a process that may fluctuate across different stages of recovery [20]. The present study supports this view by identifying two distinct developmental trajectories: the “higher-FOF declining group” and the “lower-FOF increasing group.” The “higher-FOF declining group” showed a gradual reduction in FOF over time. One study reported that the proportion of patients with FOF was lower at six months post-stroke (42%) than during the acute phase (51%) [21]. Improvements in physical function, mobility, and balance during rehabilitation may increase confidence in daily activities and may be associated with reduced FOF [22]. Higher FOF in the acute phase may also relate to uncertainty about recovery [23]. Clinically, this pattern may reflect heightened perceived threat early after stroke, followed by attenuation as recovery progresses. Management for this subgroup may emphasize early risk control and support, including safety education, graded balance and gait training, confidence-building practice for transfers and walking, and brief cognitive-behavioral components to address catastrophic beliefs and reduce avoidance.
In contrast, the “lower-FOF increasing group” exhibited a progressive rise in FOF. Prior studies have linked FOF to reduced social interaction and physical activity [15, 24, 25]. Although short-term activity restriction can reduce fall exposure, persistent avoidance may contribute to deconditioning [26], which could be associated with higher fall risk and greater FOF. FOF is associated with psychological stress, anxiety, and depression [27], which may reduce engagement in rehabilitation [28]. Clinically, this trajectory may indicate an emerging subgroup in which FOF increases over time despite a relatively low initial level of FOF and may reflect challenges encountered during later rehabilitation or after discharge. For this subgroup, post-discharge screening should be used to detect early worsening of FOF, and an upward trajectory should prompt more frequent reassessment. When escalation is observed, interventions can focus on psychoeducation, graded exposure in a controlled setting, home-environment risk assessment and modification, and structured caregiver guidance. The aim is to address rising FOF early, before it is accompanied by sustained avoidance, reduced participation, and functional decline [29].
Compared with participants with elementary school education or less, those with a middle school education were less likely to belong to the increasing group. One potential explanation is that lower educational attainment is often linked to poorer health literacy, which can limit the ability to obtain, understand, and use rehabilitation information. This, in turn, may reduce adherence to recommended mobility practice and coping strategies [30]. Among stroke survivors, higher health literacy has been related to greater self-efficacy, suggesting that limited health literacy may undermine confidence in managing post-stroke challenges and weaken self-management behaviors [31]. In fall-prevention research, inadequate health literacy has been noted to hinder understanding of educational materials and participation in interventions, which may contribute to a gradual increase in concerns about falling [32]. Consistently, adequate health literacy has been associated with a lower prevalence of falls in community-dwelling older adults, which may result in lower fall exposure and less escalation of FOF [33]. Because only the middle school category reached statistical significance, it should be interpreted cautiously and replicated in larger samples. One possible explanation for this non-linearity is that, although the odds ratio for junior college and above remained in the protective direction, it did not reach statistical significance. This estimate may have been underpowered, as only a small number of participants in this category were observed in the lower-FOF increasing group, potentially resulting in unstable estimates and reduced statistical power. Therefore, the lack of statistical significance should not be interpreted as evidence of no association. In addition, broad educational categories may not fully reflect differences in health literacy, engagement in rehabilitation, or coping capacity.
Participants without a fall history had lower odds of belonging to the increasing group than those with a fall history. This pattern is consistent with evidence in stroke populations, including a meta-analysis identifying fall history as a significant correlate of higher FOF after stroke [34]. Another meta-analysis also reported a significant association between falls and FOF in both acute and chronic stroke cohorts, suggesting that individuals who have fallen tend to report greater FOF [35]. Falls can be important events that make people judge their fall risk as higher and feel less confident about their balance, which may lead to avoiding activities. Reduced activity and less walking practice can then cause loss of strength and balance, which increases the chance of another fall and strengthens the fear. This cycle has been described in stroke-related models of FOF and fall risk [36]. Longitudinal studies also show that early fall experiences are linked to later FOF, highlighting the need for early screening and timely interventions to prevent worsening over time [37].
Participants with hemorrhagic stroke had higher odds of belonging to the increasing group than those with ischemic stroke. This finding is consistent with reports that hemorrhagic stroke is often accompanied by greater initial neurological impairment and a slower or delayed recovery, which may prolong feelings of instability during mobility and increase concerns about falling over time [38, 39]. Differences across studies in case severity, rehabilitation intensity, and the timing of assessment may partly explain variation in the strength of this association. Similar associations between stroke type and FOF have also been reported [40]. In addition, participants with three or more chronic illnesses had higher odds of belonging to the increasing group than those with two or fewer chronic illnesses. This aligns with evidence linking multimorbidity to poorer physical reserve and a higher risk of falls and FOF [41, 42]. A higher comorbidity burden may increase functional limitations, fatigue, and medication use, which can reduce gait stability and balance confidence and thereby contribute to worsening FOF [41].
Clinically, patients with a fall history, hemorrhagic stroke, or three or more chronic illnesses may warrant proactive monitoring and tailored support. Targeted strategies such as accessible health education, fall-prevention and confidence-building interventions, and coordinated chronic disease management may help mitigate the progression of FOF.
CONCLUSION
The FES-I can be administered at 1, 2, 3, 4, and 6 months after stroke onset to monitor FOF. An upward trend, defined as two consecutive increases, may indicate worsening FOF over time. Routine assessments typically focus on physical function, such as mobility and balance. Monitoring of FES-I adds fall-related psychological and behavioral information. These findings highlight the importance of early recognition of patients who may be more likely to follow an increasing FOF trajectory, particularly those with an elementary school education or below, prior falls, hemorrhagic stroke, and three or more chronic illnesses.
ETHICS APPROVAL
This study was approved by the Ethics Committee of Chengde Central Hospital, Hebei Province, China (Approval No. CDCHLL2024-403). All procedures were conducted in accordance with the Declaration of Helsinki. Before enrollment, physicians assessed each participant’s capacity to provide informed consent, and participants were enrolled based on their own agreement. Each participant was assigned a unique study ID. Names and phone numbers were stored separately from the research data. Baseline and follow-up data were recorded using study IDs. All files were password-protected and accessible only to the research team.
LIMITATIONS
This study has several limitations. Convenience sampling from a single region limits generalizability. Requiring verbal communication excluded participants with aphasia or cognitive impairment, potentially affecting the identified trajectories. The first assessment was conducted one month after stroke onset, so an acute-phase baseline was unavailable, and early rapid changes were missed. FOF was self-reported and collected through repeated face-to-face interviews, which can be influenced by misunderstanding, social desirability, and interviewer effects. Inter-rater reliability and standardization checks were not reported. The two-stage variable selection strategy may introduce instability. Although some confounders were retained a priori, the selection of the remaining variables still depended on univariate significance, which may have missed confounders that were not significant in the univariate analysis but modified the relationship. Key psychological factors such as anxiety, catastrophizing, and activity avoidance were not assessed, limiting mechanistic interpretation. Rehabilitation exposure, including therapy type and intensity, was not measured, so its impact on FOF trajectories could not be evaluated. Finally, GMM involves iterative estimation and is susceptible to local maxima and model instability, which can affect class solutions and the reliability of trajectory classification.
AUTHORS’ CONTRIBUTIONS
The authors confirm contribution to the paper as follows: W.D., F.K.H.: Study conception and design; W.D.: Data collection; W.D., F.K.H., K.L.S.: Analysis and interpretation of results; W.D.: Draft manuscript; K.L.S.: Manuscript review and editing; F.K.H., K.L.S.: Supervision. All authors reviewed the results and approved the final version of the manuscript.
LIST OF ABBREVIATIONS
| FOF | = Fear Of Falling |
| GMM | = Growth Mixture Modeling |
| FES-I | = Falls Efficacy Scale International |
| AIC | = Akaike Information Criterion |
| LMR | = Lo-Mendell-Rubin Likelihood Ratio Test |
| BLRT | = Bootstrapped Likelihood Ratio Test |
ETHICS APPROVAL AND CONSENT TO PARTICIPATE
This study was approved by the Ethics Committee of Chengde Central Hospital, Hebei Province, China (Approval No. CDCHLL2024-403).
HUMAN AND ANIMAL RIGHTS
All human research procedures followed were in accordance with the ethical standards of the committee responsible for human experimentation (institutional and national), and with the Helsinki Declaration of 1975, as revised in 2013.
AVAILABILITY OF DATA AND MATERIALS
All the data and supporting material are available within the article.
ACKNOWLEDGEMENTS
The authors sincerely thank the nurses who volunteered for this study, as well as the nursing managers and hospital administration for their assistance and cooperation throughout the study.