All published articles of this journal are available on ScienceDirect.

Study of Coronavirus Disease (COVID-19) Outbreak in India
Abstract
Background:
COVID-19 is an infectious disease caused by severe acute respiratory syndrome Coronavirus 2 (SARS-CoV-2). It has been recognized as a pandemic by the World Health Organization (WHO) on 11th March, 2020.
Objective:
To identify various factors that can increase coronavirus spread in India and predict COVID-19 cases up to 27th December, 2020, minimum and maximum number of deaths due to COVID-19 in India.
Methods:
This work predicts COVID-19 cases, the minimum and the maximum number of deaths due to COVID-19 in India based on the infection rate and suspected cases.
Results:
Our result shows that the number of COVID-19 cases will increase exponentially in India to approximately 859421415 cases by 27th December 2020.
Conclusion:
The spread of COVID-19 in India depends on a lot of factors such as religious congregation, social contact structure, low testing rates, identification of COVID-19 suspects, measures such as lockdown and sealing of hot stop, etc. taken by the Indian government. In India, lockdown proved to be a good decision.
1. INTRODUCTION
The outbreak of novel pathogenic Coronavirus (2019-nCoV) [1-6] was first identified in Wuhan city of Hubei Province of South China on 31st December, 2019. It was recognized as a Pandemic by the World Health Organization on 11th March, 2020. The Coronavirus disease has been officially named as COVID-19. COVID-19 is an infectious disease caused by severe acute respiratory syndrome Coronavirus 2 (SARS-CoV-2). World Health Organization (WHO) had declared the outbreak a Public Health Emergency of International Concern on 30th January, 2020. There are several reports regarding the timeline of the Coronavirus outbreak. According to media reports on unpublished Chinese government data, the first case of COVID-19 emerged on 17th November, 2019 [7-10]. According to a study by Chinese researchers published in the Lancet medical journal, the first patient with the symptoms of COVID-19 was identified on 1st December, 2019 [11-15]. Like Middle East Respiratory Syndrome (MERS-CoV) [16-20] and Severe Acute Respiratory Syndrome (SARS-CoV) [21-24]. Coronavirus is a large family of viruses that causes illness ranging from the common cold to severe disease. COVID-19 is a disease that mainly affects the respiratory system and most infected people recover without requiring specific treatment. People above the age of 60 years and who have underlying medical conditions are at higher risk. According to World Health Organization (WHO), the symptoms of COVID-19 include:
- Fever, tiredness, dry cough as the most common symptoms.
- Sore throat, diarrhoea, pains and aches, conjunctivitis, loss of taste or smell, headache, discolouration of toes or fingers or rashes on skin as less common symptoms.
- Shortness of breath or difficulty breathing, loss of movement or speech, chest pain as some serious symptoms.
The Coronavirus disease first emerged in China in December 2019 and spread globally rapidly. When a person with COVID-19 [5-8] exhales or coughs, small droplets spread out in the surrounding environment and land on surfaces and objects around the person. Other people then catch COVID-19 directly by inhaling these small droplets or indirectly by touching contaminated surfaces or objects then touching their nose, mouth or eyes. The survival of Coronavirus depends on various factors such as humidity or temperature of the environment and type of surface. The risk of catching COVID-19 from the faeces of an infected person and someone with no symptoms at all appears to be very low. In India, the first case of coronavirus was reported in Kerala on 30th January, 2020 [25]. As of 5th December, 2020, the recovery rate of COVID-19 in India is 98.48%, a total of 9499710 cases and 140216 deaths have been confirmed by worldometer website in India. The number of infections could be a substantial underestimate due to low testing rates of India [26, 27]. Following are some protective measures against COVID-19, advised by the World Health Organization (WHO) [28].
(1) Maintain social distancing: you should maintain at least 1-meter distance from a person who is sneezing or coughing.
(2) Regular hand washing: one should thoroughly and regularly clean his/her hands with soap and water or alcohol-based hand wash.
(3) Seek medical care early, if you have cough, fever and shortness of breath.
(4) Avoid unnecessary travel
(5) Maintain respiratory hygiene: you should not sneeze in the bare hand, always make sure that you cover your nose and mouth with a tissue or with your bent elbow.
(6) Avoid touching nose, mouth and eyes: if you touch your eyes, mouth and nose with contaminated hands, then the virus can enter your body.
On 28th March 2020, there were 25,778 numbers of government hospitals and 7.13 lakh number of beds in government hospitals and in government hospitals, the availability of beds was 0.55 beds per 1000 population [28]. Therefore, India had taken several measures to stop coronavirus spread. Such measures are as follows:
(1) Lockdown the entire nation for 21 days from 24th March 2020 to 14th April 2020 to break Coronavirus chain.
(2) India is trying to quickly ramp up its fragile healthcare facilities.
(3) Conversion of railway coaches and medical colleges into isolation wards, etc.
In this study, we tried to present an early prediction of the epidemic of COVID- 19 in India based on infection rate and suspected cases and our mathematical model forecasts the minimum and the maximum number of deaths, due to COVID-19 in India, for the different number of infected cases. Our results are supposed to provide important information regarding the upcoming infected number of people, which will help manage COVID-19 crisis.
The contribution of this paper is structured as follows: Section 2 elaborates motivation for research. Section 3 depicts the methodology and section 4 discusses the result of the proposed model and section 5 concludes the research paper by summarizing our work.
2. MOTIVATION
The outbreak of Coronavirus has brought life to a near standstill in almost every part of the world. The cases of COVID-19 have been increasing day by day. As of 6th December 2020, a total of 66,964,380 infected patients and 1,536,618 deaths have been confirmed by the Worldometer website in the world. The highest number of deaths have been recorded in United States so far. According to the World Health Organization (WHO), the most urgent threat to the ability to save lives is a chronic shortage of protective equipment. As of 6th December, 2020, the United States has recorded the highest number of Coronavirus cases i.e. 14,983,425 and 287,825 deaths (Table 1). [29]
| Countries | Total Cases | Total Deaths | Total Recovered |
|---|---|---|---|
| Italy | 1,709,991 | 59,514 | 896,308 |
| USA | 14,983,425 | 287825 | 8,787,738 |
| Spain | 1,699,145 | 46,252 | 150376 |
| China | 86,619 | 4,634 | 81,706 |
| Iran | 1,040,547 | 50,310 | 730,798 |
| India | 9,644,529 | 140,216 | 9,100,792 |
Table 2 shows that the total number of cases (COVID-19), deaths due to coronavirus and recoveries of patients infected with COVID-19 for different countries, as of 6th December, 2020. There are many companies and academic institutions racing to find a COVID-19 cure. Lopinitor, ritonavir, ribavarin, darunavir and remindasvir are some drugs that are under trials for COVID-19 treatment. Many COVID-19 vaccine projects are using the approaches which have already been tested and tried while others are using new technologies. The vaccine must be tested to ensure that they will not cause any side effects. The trial methodology of a vaccine lasts between six and eight months. If the vaccine is prepared, then the biggest challenge would be its production in the volume necessary to end a pandemic. Following are some COVID-19 vaccine candidates currently in Phase 3 trial
| Date | Infected Cases | Deaths | Death Rate (%) | Country |
|---|---|---|---|---|
| 1 to 30 April | 34863 | 1154 | 3.310 | India |
| 1 to 31 May | 190609 | 5408 | 2.837 | India |
| 1 to 30 June | 585792 | 17410 | 2.972 | India |
| 1 to 31 July | 1697054 | 36551 | 2.153 | India |
| 1 to 31 August | 3687939 | 65435 | 1.774 | India |
| 1 to 30 September | 6310267 | 98708 | 1.564 | India |
| 1 to 31 October | 8182881 | 122149 | 1.492 | India |
| 1 to 30 November | 9463254 | 137659 | 1.454 | India |
| 1 to 30 April | 236356 | 25437 | 10.76 | Spain |
| 1 to 31 May | 249679 | 29050 | 11.63 | Spain |
| 1 to 30 June | 259119 | 29385 | 11.34 | Spain |
| 1 to 31 July | 311358 | 29476 | 9.466 | Spain |
| 1 to 31 August | 515980 | 30148 | 5.842 | Spain |
| 1 to 30 September | 815543 | 32942 | 4.039 | Spain |
| 1 to 31 October | 1303411 | 37311 | 2.862 | Spain |
| 1 to 30 November | 1671548 | 45069 | 2.696 | Spain |
| 1 to 30 April | 205449 | 28036 | 13.64 | Italy |
| 1 to 31 May | 233000 | 33508 | 14.38 | Italy |
| 1 to 30 June | 240599 | 34921 | 14.51 | Italy |
| 1 to 31 July | 247537 | 35295 | 14.25 | Italy |
| 1 to 31 August | 269217 | 35483 | 13.18 | Italy |
| 1 to 30 September | 314861 | 35894 | 11.39 | Italy |
| 1 to 31 October | 679428 | 38618 | 5.683 | Italy |
| 1 to 30 November | 1601551 | 55576 | 3.470 | Italy |
| 1 to 30 April | 82862 | 4633 | 5.591 | China |
| 1 to 31 May | 83001 | 4634 | 5.583 | China |
| 1 to 30 June | 83531 | 4634 | 5.547 | China |
| 1 to 31 July | 84292 | 4634 | 5.497 | China |
| 1 to 31 August | 85048 | 4634 | 5.448 | China |
| 1 to 30 September | 85403 | 4634 | 5.426 | China |
| 1 to 31 October | 85973 | 4634 | 5.390 | China |
| 1 to 30 November | 86530 | 4634 | 5.355 | China |
| 1 to 30 April | 163009 | 6623 | 4.062 | Germany |
| 1 to 31 May | 183494 | 8605 | 4.689 | Germany |
| 1 to 30 June | 195832 | 9052 | 4.622 | Germany |
| 1 to 31 July | 210665 | 9224 | 4.378 | Germany |
| 1 to 31 August | 244792 | 9371 | 3.828 | Germany |
| 1 to 30 September | 292911 | 9571 | 3.267 | Germany |
| 1 to 31 October | 531790 | 10583 | 1.990 | Germany |
| 1 to 30 November | 1069763 | 16862 | 1.576 | Germany |
(1) BNT162:
• It is a mRNA-based vaccine
•It has been jointly developed by Pfizer and BioNtech
(2) AZD1222:
• It is a replication-deficient viral vector vaccine, a chimpanzee adenovirus vaccine.
• It has been developed by AstraZeneca and University of Oxford
(3) mRNA-1273:
• It is also an mRNA- based vaccine.
• Based on prior studies of related coronaviruses like those that cause Middle East respiratory syndrome (MERS) and severe acute respiratory syndrome (SARS), Moderna has developed this vaccine.
(4) Covaxin:
• It is an inactivated vaccine or killed vaccine.
• It has been developed by Bharat Biotech and National Institute of Virology of India.
(5) JNJ-78436735, formerly called Ad26.COV2.S
• It is a Non-replicating vector vaccines
• Using AdVac and PER.C6 systems, Johnson & Johnson has developed this vaccine.
(6) Ad5-nCoV:
• It incorporates the adenovirus type 5 vector (Ad5)
• It has been developed by China’s CanSino Biologics
(7) CoronaVac:
• It is a formalin-inactivated and alum-adjuvanted candidate vaccine.
• It has been developed by Chinese biopharmaceutical company Sinovac.
But still, we are not sure that when we will get a workable vaccine against COVID-19. So, it has become very important for us to reduce the risk of infection by following the guidelines given by the World Health Organization (WHO). In this note, we will see the economic impact of COVID-19.
Several countries have been adversely impacted due to the spread of COVID- 19 globally. According to a report from the consultancy McKinsey and Company, the United States could take three years to recover from the impact of COVID-19 crisis. On 26th March, 2020, Moody’s Investors Service revised its estimate for India’s GDP growth in the financial year 2020 to 2.5% from 5.3% and CRISIL (rating agency of India) slashes its projection for India's GDP growth in the financial year 2021 from 5.7% to 5.2%. Isolation is important as it acts as a defence against the spread of COVID-19 virus. This study would help to understand which control measures work. The people with an illness must be identified first to prevent further transmission of the virus. There are many uncertainties regarding COVID-19. Therefore, research must be conducted to find out the answers to various questions like by which month coronavirus will fade out, number of deaths, infection rate, etc., which will help the government in taking the rights measures, benefit various health organizations and the community at large. Good research in this area can save many lives and will also be helpful for other researchers working in the same field. An accurate prediction about the spread of COVID-19 in the next few weeks could be used to make better business decisions.
Table 3 shows the total number of infected cases, number of deaths and death rate for six countries, viz., Italy, Germany, Spain, China and India.
3. WEEKLY ANALYSIS OF INFECTED AND DEATH CASES IN DIFFERENT COUNTRIES
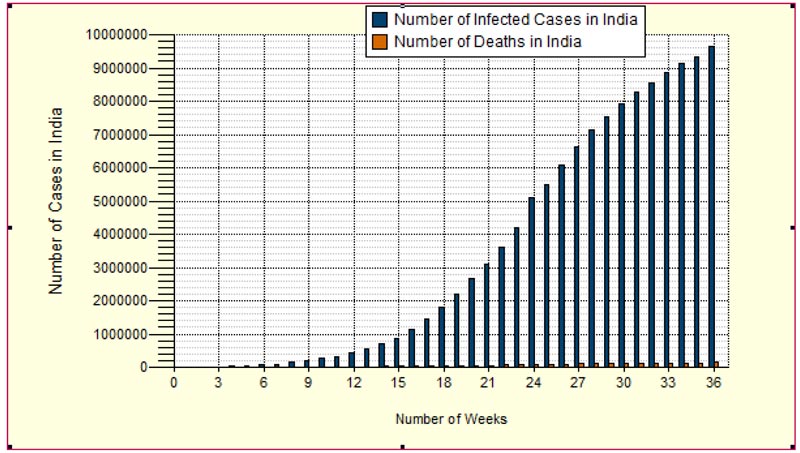
In Fig. (1), X-axis represents the number of weeks i.e. week 1 from 22nd March to 29th March, week 2 from 30th March to 5th April, week 3 from 6th April to 12th April, etc. Y-axis shows the number of infected cases and deaths due to Coronavirus in India. The graph shows that the number of deaths was very less in the first week i.e. 27 deaths for 1024 cases in India, which increased to 140216 deaths in the week from 20th November to 5th December amid lockdown.
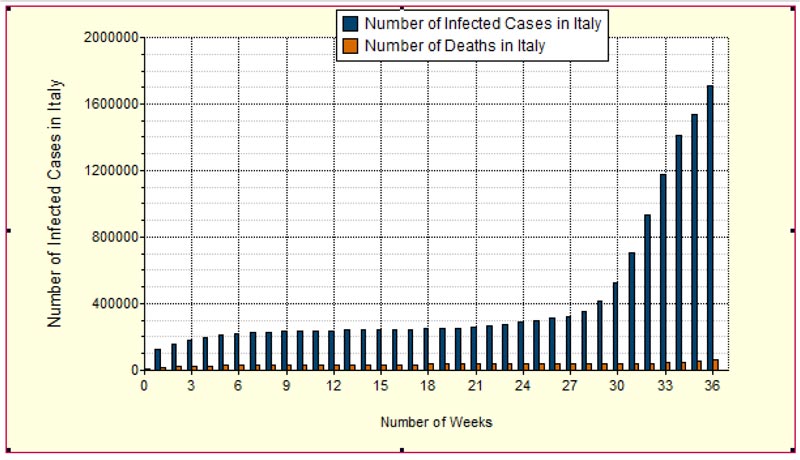
In Fig. (2), X-axis shows the number of weeks i.e. week 1 from 22nd March to 29th March, week 2 from 30th March to 5th April, week 3 from 6th April to 12th April, so on. Y-axis shows the number of infected cases and deaths due to Coronavirus in Italy.
Table 3.
| Cases | Death Rate (%) | Predicted No. of Deaths | ||
|---|---|---|---|---|
| Infected Cases | Minimum | Maximum | Minimum | Maximum |
| 10,000,00 | 3.87 | 5 | 38700 | 50000 |
| 20,000,00 | 2.90 | 5 | 58000 | 100000 |
| 30,000,00 | 2.43 | 5 | 72900 | 150000 |
| 40,000,00 | 2.19 | 5 | 87600 | 160000 |
| 50,000,00 | 2.04 | 4 | 102000 | 200000 |
| 60,000,00 | 1.87 | 4 | 112200 | 240000 |
| 70,000,00 | 1.75 | 4 | 122500 | 280000 |
| 80,000,00 | 1.62 | 4 | 129600 | 320000 |
| 90,000,00 | 1.54 | 4 | 138600 | 360000 |
| 10,000,000 | 1.52 | 4 | 152000 | 400000 |
| 11,000,000 | 1.59 | 4 | 165000 | 440000 |
| 12,000,000 | 1.40 | 4 | 168000 | 480000 |
| 13,000,000 | 1.36 | 3 | 176800 | 390000 |
| 14,000,000 | 1.25 | 3 | 175000 | 420000 |
| 15,000,000 | 1.10 | 3 | 165000 | 450000 |
| 16,000,000 | 1 | 3 | 160000 | 480000 |
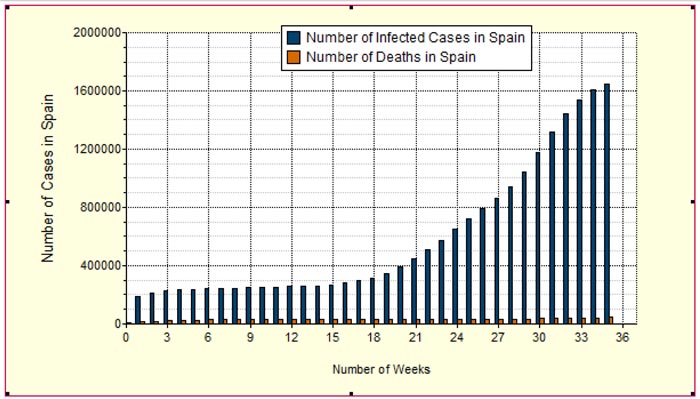
In Fig. (3), Y-axis represents the number of infected cases and deaths due to COVID-19 in Spain while the X-axis represents the number of weeks, week 1 from 22nd March to 29th March, week 2 from 30th March to 5th April, week 3 from 6th April to 12th April, 2020 and so on.
In Fig. (4), X-axis shows the number of infected cases and deaths due to COVID-19 in China while the X-axis shows the number of weeks i.e. week 1 from 22nd March to 29th March, week 2 from 30th March to 5th April, week 3 from 6th April to 12th April, 2020 and so on.

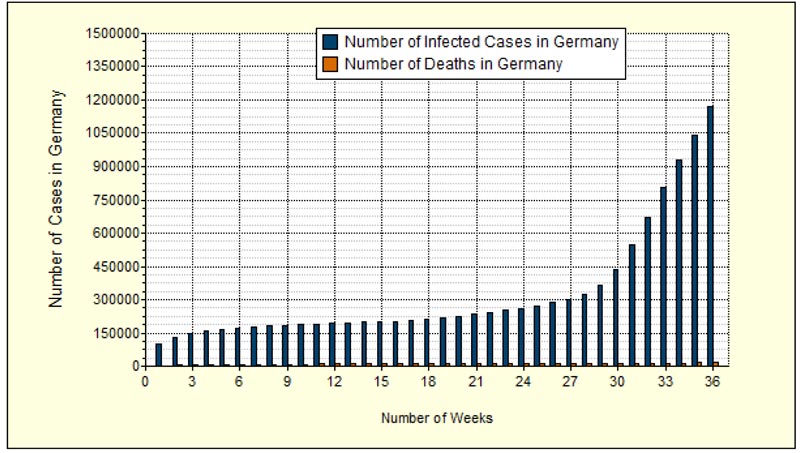
In Fig. (5), Y-axis shows the number of infected cases and deaths due to COVID-19 in Germany while the X-axis shows the number of weeks i.e. week 1 from 22nd March to 29th March, week 2 from 30th March to 5th April, week 3 from 6th April to 12th April, 2020 and so on.
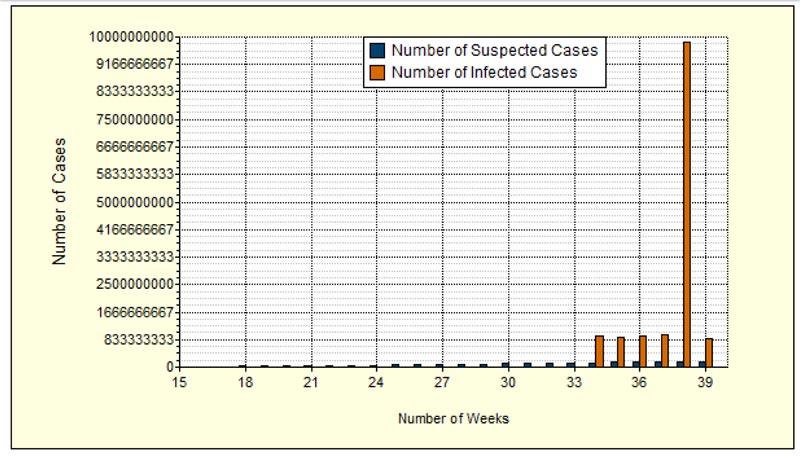
In Fig. (6), Y-axis shows the number of coronavirus cases date-wise in India. The number of suspected cases are shown by blue colour line and the number of infected cases in India are shown by the mustard colour line. We propose the minimum and the maximum number of predicted deaths based on the minimum and maximum death rate, as shown in Table (4) below:
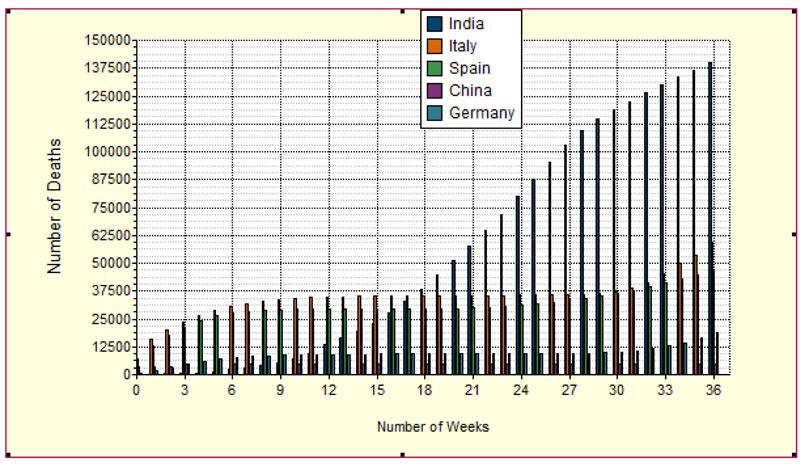
Fig. (7) shows weekly deaths in different countries, viz., China, Germany, Italy, China, Spain and India. From the result, it is evident that Italy has the highest death rate in comparison to other countries while India has the lowest death rate.
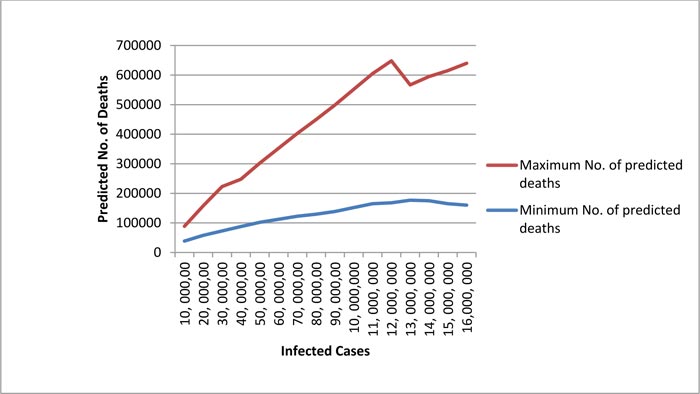
In Fig. (8), X-axis shows the number of infected cases and Y-axis shows the predicted number of deaths. The minimum number of predicted deaths is shown by blue colour line and the maximum number of predicted deaths, due to COVID-19 in India are shown by the red colour line. As shown in the graph, for 10, 000, 00 infected cases, the number of deaths would lie between 38700 and 50000, and for 20, 000, 00 infected cases, the number of deaths would lie between 58000 and 100000.
| Term | Definition |
|---|---|
| D | Date |
| IR | Infected Rate |
| S | Number of Suspected Cases |
| Y | Total Infected People |
| n | Number of Day |
3.1. Issues for Prediction of COVID-19 Cases in India
3.1.1. Religious Congregation:
Over 3400 people had gathered in Delhi for Tablighi Jamaat event on 13th March 2020. Following are some cases of COVID-19, which had a relationship with this event.
- On 26th March, after batting with COVID-19, a businessman died in Srinagar.
- On 30th March, six deaths because of Coronavirus were reported from Telangana (India).
- On 31st March, ten people had tested positive from Coronavirus from Andaman and Nicobar Islands of India.
Around 1,500 people were sent to their respective states from Markaz on 23rd March 2020 and it is not known that how many of them were coronavirus positive. According to the Union Health Ministry, 2,100 foreigners visited India for Tablighi event in 2020 and these were from Thailand, Malaysia, Indonesia, Nepal, Myanmar, Sri Lanka, Bangladesh and Kyrgyzstan. On 2nd April, over 5,000 of those identified who have attended the congregation have been quarantined. On 23rd March 2020, around 1,500 people were sent to their respective states from Markaz and their COVID-19 status is unknown. This gathering can make a trail of infection. Our work shows that these 1500 people can affect other 120 people or more in a single day. Based on the hypothesis, we can say that at least 30 people may have coronavirus symptoms, which further infect four other people during their journey from their home to Nizamuddin Markaz and from Markaz to their home. The Indian government announced 21-days complete lockdown on 23rd March. The lockdown started from 24th March and ended on 3rd May. As of 6th April 2020, nearly a third of total COVID-19 positive cases were linked to the Tablighi Jammat congregation. Before the Jammat event, the rate of doubling of COVID-19 cases in India was 7.4 days, which accelerated to 4.1 days after the event. More than 8,000 people attended the congregation in early March, according to the Indian government. India has tested 0.10 samples per thousand people as of 9th April 2020, which is not enough to identify the attendance of Jammat event. Any such event in the future will be detrimental to the well-being of the nation and will severely affect the health of people.
3.1.2. Lifting of the Lockdown:
Completely lifting the lockdown can speed up the infection rate. Considering the fact that lockdown was removed by 14th April 2020, a person having COVID-19 could infect other 406 people within a month, while during lockdown, a person having COVID-19 was infecting approx 2.5 people within a month. Several State governments in India declared the sealing of coronavirus hotspot to control COVID- 19. If implemented effectively, the measures will prove to be helpful in controlling further coronavirus spread. We strongly recommend further lockdown extension. The lockdown will not be enough to stop coronavirus spread; it is just a response time in which some important measures such as contact tracing, social distancing and isolating those in close contact with infected patients etc, can be taken. India has been on lockdown from 24th March to 14th April but it should be extended to get enough time to cope up with the intensifying situation.
3.1.3. Congested Dwellings in India:
Some places like Dharavi slum of Mumbai and congested dwellings such as Sangli in Maharashtra could increase the risk of community transmission.
3.1.4. The Testing Rate in India:
Testing rate of COVID-19 in India is one of the lowest testing rates in the world. The people who have travelled to high-risk countries or those who have been in touch with a person or symptomatic healthcare worker or patients with severe respiratory disease are eligible for testing. According to the Indian Council of Medical Research, 25,254 samples have been tested in India as of 25th March, out of which 581 were positive. The current number of infected cases is small for a country like India. One of the reasons for this may be inadequate testing. Lockdown will not be enough to break the infection chain; COVID-19 cases in India have been increasing amid lockdown. India has a lower percentage of positive cases as it has a lower test rate. India may see a surge in cases in the upcoming days as it is increasing its testing rates. As of 25th March 2020, about one in every test conducted for COVID-19 in India were positive. In comparison, about a sixth in Austria, about a quarter in Italy were positive. The number of COVID-19 infections is increasing as the Indian government has allowed private labs to conduct tests. According to the Indian Council of Medical Research, India has tested 47,951 samples by 31st March. According to the Indian Council of Medical Research chief Epidemiologist RR Gangakhadkhar, India has a testing capacity of 12,000 samples a day. Our model suggests that India needs to test more as more tests will identify more coronavirus patients. Some of the Countries such as South Korea and Germany have managed to control fatalities from COVID-19 to a large extent as they conducted large scale testing.
3.2. Prediction for COVID-19 Infected Cases in India
Fig. (9) consists of two horizontal timelines, the first horizontal timeline shows date wise suspected cases while the second horizontal timeline shows the weekly infected rate in India.
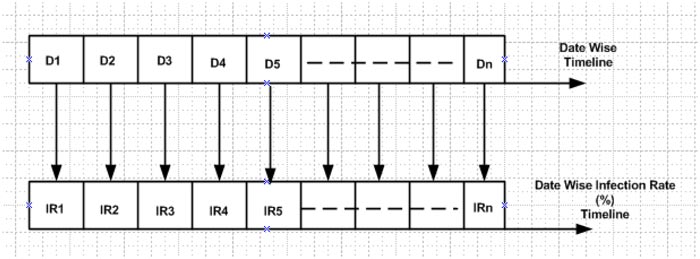
Description of notation used is depicted in Table 5. [30, 31] We propose a simple mathematical model for the calculation of weekly infected cases. Description of such a model is given below:
| Weeks | Tests (Suspected cases) | No of Confirmed Cases in India | Infected Rate (%) | Range |
|---|---|---|---|---|
| 22 to 29 March | 38442 | 1024 | 2.663753187 | 2 to 4 |
| 30 to 5 April | 89534 | 4289 | 4.79035897 | - |
| 6 to 12 April | 195743 | 9205 | 4.702594729 | - |
| 13 to 19 April | 401586 | 17615 | 4.38635809 | - |
| 20 to 26 April | 625309 | 27890 | 4.46019488 | 4 to 5 |
| 27 to 3 May | 1046450 | 42505 | 4.061828085 | - |
| 4 to 10 May | 1609037 | 67161 | 4.173987298 | - |
| 11 to 17 May | 2227642 | 95698 | 4.29593265 | - |
| 18 to 24 May | 2943421 | 138536 | 4.706632181 | - |
| 25 to 31 May | 3737027 | 190609 | 5.100551856 | - |
| 1 to 7 June | 4666386 | 257486 | 5.517889004 | 5 to 6 |
| 8 to 14 June | 5658614 | 332783 | 5.880998421 | - |
| 15 to 21 June | 6807226 | 426910 | 6.271423925 | 6 to 7 |
| 22 to 28 June | 8227802 | 549197 | 6.674893246 | - |
| 29 to 5 July | 9789066 | 697836 | 7.128729135 | 7 to 8 |
| 6 to 12 July | 11587153 | 879466 | 7.590009384 | - |
| 13 to 19 July | 13791869 | 1118107 | 8.107001306 | 8 to 9 |
| 20 to 26 July | 16291331 | 1436019 | 8.814620487 | - |
| 27 to 2 August | 19821831 | 1804702 | 9.104618035 | - |
| 3 to 9 August | 24106535 | 2214137 | 9.184799889 | 9 to 8 |
| 10 to 16 August | 29309703 | 2647316 | 9.032217078 | - |
| 17 to 23 August | 35292220 | 3105185 | 8.798497233 | - |
| 24 to 30 August | 41461636 | 3619169 | 8.7289585 | 8 to 9 |
| 31 to 6 Sep | 48831145 | 4202562 | 8.606314679 | - |
| 7 to 13 Sep | 56260928 | 5115893 | 9.093154311 | 9 to 8 |
| 14 to 20 Sep | 63661060 | 5485612 | 8.616903331 | - |
| 21 to 27 Sep | 71257836 | 6073348 | 8.523059836 | - |
| 28 to 4 Oct | 78992534 | 6622180 | 8.383298604 | 8 to 7 |
| 5 to 11 Oct | 86877242 | 7119300 | 8.194666216 | - |
| 12 to 18 Oct | 94224190 | 7548238 | 8.010934347 | - |
| 19 to 25 Oct | 102523469 | 7909050 | 7.714380012 | - |
| 26 to 1 Nov | 109887303 | 8266914 | 7.5230839 | - |
| 2 to 8 Nov | 117736791 | 8553864 | 7.265243028 | 7 to 6 |
| 9 to 15 Nov | 124836819 | 8845617 | 7.08574367 | - |
| 16 to 22 Nov | 131836819 | 924176101 | 7.01 | - |
| 23 to 29 Nov | 139200653 | 920116316 | 6.61 | - |
| 30 to 6 Dec | 147050141 | 955825916 | 6.5 | - |
| 7 to 13 Dec | 154150169 | 971146064 | 6.3 | 6 to 5 |
| 14 to 20 Dec | 161150169 | 9830160301 | 6.1 | - |
| 21 to 27 Dec | 168514003 | 859421415 | 5.1 | - |
Y2= S2 ×IR2
Y3= S3 ×IR3
Y4= S4 ×IR4
Yn= Sn ×IRn
Here, we calculate the value of the infected rate for India based on the infected rate for different countries, which is depicted in Table 4.
We predict that the number of COVID-19 cases will increase exponentially in India to approximately 859421415 cases by the end of 2020. While predicting the theoretical number of infected cases in India based on infection rate, we are considering the fact that the lockdown would be extended until the first week of May and all other parameters are constant.
Table 5 shows the number of suspected cases and infected cases, infected rate and range of infected rate. Our results show that there will be 859421415 infected cases in India in the last week of December 2020.
CONCLUSION
This paper has presented a study of the Coronavirus Disease (COVID-19) Outbreak in India. The spread of COVID-19 in India depends on a lot of factors especially, the religious gathering of people, which can act as a super spreader of COVID-19. Any such gathering in the future will be detrimental to the health of people. In India, lockdown proved to be a good decision and it should be extended further. There are many unknown parameters that can cause large uncertainties in the prediction; the prediction is supposed to help the Government in further decision making and in coping with the ongoing coronavirus transmission in India. As predicted by this study, more focus should be given to the control measures such as speeding the testing rate, maintain social distancing, avoid unnecessary gathering. If all these efforts are taken into consideration, then the severity of COVID-19 in India may be controlled at a relatively low level finally. The findings of this study increase the knowledge level of nurses, which will enhance their willingness to work with high-risk patient groups. The results of this paper will be useful in managing the healthcare resources in advance and for the development of good nursing.
AUTHORS’ CONTRIBUTIONS
V.D proposed a prediction method for COVID-19 cases in India, which is evaluated in terms of death and infection rate. V.K guided in the prediction for death and infected COVID-19 cases in India. All authors read and approved the final manuscript.
CONSENT FOR PUBLICATION
Not applicable.
FUNDING
None.
CONFLICT OF INTEREST
The authors declare no conflict of interest, financial or otherwise.
ACKNOWLEDGEMENTS
Declared none.