All published articles of this journal are available on ScienceDirect.

Correlation Between Surface Cleaning and Disinfection Methods in an Emergency Room
Authors Info & Affiliations
Abstract
Objective:
To evaluate the correlation between microbiological culture, ATP tests by bioluminescence and visual inspection for monitoring the surface cleaning and disinfection in an emergency room.
Methods:
This is a prospective, analytical study with a quantitative approach. Data analysis was guided by the following tests: Spearman’s correlation, Fisher ‘s exact test and receiver operating characteristic (ROC) curve.
Results:
There was a correlation between ATP quantification methods and microbial count for the women’s bathroom door handle (ρ = 0.526; p= 0.008). In this study, considering the ROC curve, the ATP value below 20 RLU is suggested to classify surfaces as approved in the emergency room.
Conclusion:
Using different methods of monitoring the cleaning and disinfection process is essential, considering that each method has a different purpose.
1. INTRODUCTION
Health services present a risk for the spread of microorganisms, playing a role as an environmental reservoir. The literature shows that contaminated surfaces are a considerable source of transmission of pathogens, including multidrug-resistant agents [1]. Several hospital pathogens are spread by patients through contamination of hospital surfaces, mainly through contact with the hands [2].
There is an increasing concern about the survival of microorganisms on surfaces in hospitals, such as methicillin-resistant Staphylococcus aureus, vancomycin-resistant enterococci, norovirus, Clostridium difficile and Acinetobacter [3]. These also include the currently spread human coronavirus, which can remain on environmental surfaces for up to 9 days. However, these microorganisms can be eliminated with appropriate cleaning and disinfection procedures [4]. Therefore, cleaning the environment in hospitals is essential for the quality of care as it impacts the infection rates [5].
Nevertheless, cleaning and disinfection practices in health services are often unsatisfactory, and methods are required to monitor this cleaning and disinfection process (CDP)(6). In the literature, there are several methods for monitoring, including the measurement of Adenosine Triphosphate (ATP), Aerobic Colony Count (ACC) and Visual Inspection. Each method has advantages and disadvantages.
The disadvantage of the aerobic colony count (ACC) method is the need for a laboratory for the analysis of plaques, and the results for reading are only available after 24 hours. But as a strong point, it detects the presence of pathogens and is relatively simple [7].
The ATP quantification, present in organic matter, is a fast method with objective measures, which provide quick feedback to the team. Its disadvantage is the need for a device for reading and a specific swab, making it a bit costly [7, 8].
Another method is visual inspection, which has a low cost, is simple to perform but does not offer objective and measurable data in relation to the cleaning and disinfection process completed [7]. Therefore, the combined use of CDP monitoring methods is more assertive, instead of choosing only one method as an indicator [9].
In this context, correlating the methods for the CDP assessment is indispensable, especially in an emergency environment in the hospitals, as studies on this theme are scarce. Thus, the aim of this study is to assess the correlation between microbiological culture, ATP test by bioluminescence and visual inspection for monitoring the surface cleaning and disinfection in an emergency room.
2. METHODS
2.1. Study Design, Local and Period
This is a prospective, interventional, analytical and comparative study. The study was carried out in the city of Coxim, state of Mato Grosso do Sul, from September 2018 to March 2019, always between 06:00 a.m. and 12:00 p.m. This city is a reference for a population of 78,418 inhabitants, linked to 05 municipalities in the state’s northern region. Data collection took place in an urgent and emergency service (emergency room), linked to a hospital that had 65 hospital beds in specialties namely, general surgery, gynecology, orthopedics/traumatology, cardiology, general practice, surgical obstetrics, clinical obstetrics, psychiatry and clinical pediatrics [10].
2.2. Institution’s Standard Protocol
The CDP in the emergency room was carried out in a shared way, at each shift change, 3 times a day, at 7 am, 1 pm and 7 pm, by the cleaning team (8 professionals - women) and nursing technicians (16 professionals - 02 men and 8 women). In the emergency service, a disinfectant was available for fixed surfaces, without rinsing, with the following composition: alkyl dimethyl benzyl ammonium chloride, emulsifier, foam adjuster, preservative, fragrance, dye and vehicle. A 70% ethanol solution was also available, recommended for disinfection of fixed surfaces composed of hydrated ethyl alcohol - 70% INPM. Other products were also available: dishwashing detergent with composition: 90% benzene sulfuric linear acid, ether, sodium sulfate, humectant, neutralizer, preservative, dye, essence and vehicle) and other disinfectants with composition: alkyl dimethyl benzyl ammonium chloride, emulsifier, foam adjuster, preservative, fragrance, dye and vehicle.
The institution had a described protocol, but it was not defined in the protocol which product should be used on each surface. The cleaning team used disinfectants and detergents and the nursing team used 70% ethanol solution. The product dilution process was carried out by a member of the cleaning team. As for inputs, cotton cloths were made available in the unit, but their use in the protocol was not standardized either; each professional used it according to their choice.
2.3. Study Protocol
Four surfaces were chosen to be monitored, the dressing cart and medication preparation bench, which were cleaned by the nursing staff and the door handle surfaces of the patients’ bathroom and the flush toilet handle of the patients’ bathroom, which were cleaned by the hygiene and cleaning team. The collections always occurred 10 minutes after the CDP was performed, to allow product action [8].
The choice of these surfaces was based on a non-probabilistic convenience sample, as well as the choice of some of these surfaces in other studies [11-13]. In addition, the surface choice is justified because these surfaces have a high contact frequency, both by patients and professionals, requiring better reinforcement in the CDP [14].
The study consisted of 3 stages, in all stages, CDP monitoring of surfaces was carried out using the methods: visual inspection, ACC and ATP measurement. Four samples were collected before and 4 after CDP, twice a week, totaling 192 assessments per phase, according to (Table 1).
| Method |
Stage 1 (4 weeks of collection) |
Stage 2 (4 weeks of collection) | Stage 3 (4 weeks of collection) | Number of Assessments |
|---|---|---|---|---|
| Visual | 64 | 64 | 64 | 192 |
| ATP | 64 | 64 | 64 | 192 |
| CFU | 64 | 64 | 64 | 192 |
| TOTAL | 192 | 192 | 192 | 576 |
| Surfaces | Spearman’s coefficient | p-value |
|---|---|---|
| Medication preparation area | 0.186 | 0.385 |
| Dressing cart | -0.055 | 0.797 |
| Women’s Bathroom Door Handle | 0.526 | 0.008 |
| Women’s flush toilet handle | 0.181 | 0.399 |
2.4. Monitoring Parameters Adopted
For the assessment with the use of visual inspection, the surface was defined as dirty (reproved), when it presented some of the elements on the surface: dirt, spots, dust, scratch, deterioration, splinters or scratches [15, 16].
Regarding the ATP measurement, the reference value proposed in several studies for reading was used, of the swabs (3M ™ Clean-Trace™ ATP Surface), which were rubbed on the surface to be assessed, and later introduced in a portable luminometer device (NGi 3M™ Clean-Trace ™ St Paul, MN), which provides reading by the bioluminescence technique, in Relative Light Units (RLU] [16-18].
For ACC monitoring, 24 cm2 Rodac Plate® contact plates (Biocen do Brasil) were used. For 10 seconds, the plates were rubbed on the surface and then taken to an oven at 37º. Using the electronic and digital colony counter (Logenr LS6000), readings were performed after 48 hours [12, 19, 20].
2.5. Statistical Analysis
All statistical tests were applied with a significance level of 5% or (p<0.05) and the software used was: Minitab 17 (Minitab Inc.) and MedCalc 16.8 (MedCalc®).
The data were analyzed using the following statistical tests: Fisher’s exact test for two proportions to observe differences in the assessment of surfaces by visual inspection; and Spearman’s correlation test to observe possible correlations between the quantification of continuous variables (ATP and microbial count on each surface before and after cleaning and disinfection). And the ROC Curve (receiver operating characteristic) was used with the objective of verifying which quantitative method is the most effective to determine the cleaning quality of a surface in relation to the colony counting method (gold standard).
3. RESULTS
At the end of each stage, 192 assessments were made, which represent a total of 576 assessments performed at the end of stages 1, 3 and 4, considering the three monitoring methods: visual, ATP Bioluminescence and CFU.
The correlation between the ATP (RLU) and microbial count (CFU) methods, regardless of the phase evaluated, was assessed by applying the Spearman’s correlation test (Table 2).
The results indicate the presence of a significant correlation between the ATP quantification methods and microbial count for the women’s bathroom door handle (ρ = 0.526; p= 0.008). Although the P-value is significant, in both cases, the correlation is median, as the coefficient was less than 0.700, indicating that the correlation is linear and positive for the mentioned surface (Fig. 1), that is, the greater the ATP quantification, the higher the microbial count.
3.1. ROC Analysis
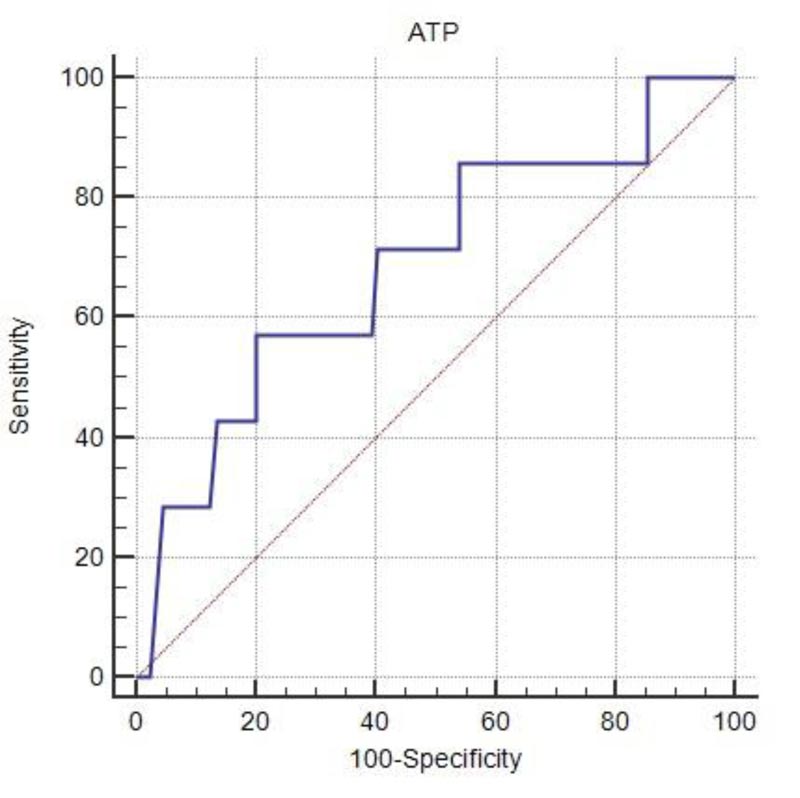
The ROC curve presents the results of the assessment of ATP quantification methods in relation to the gold standard microbial count (CFU) (Table 3).
The ATP quantification method when related to microbial count as the gold standard shows that the ATP quantification is indicated for the verification of dirty surfaces, as the specificity resulted in higher values in relation to sensitivity. (Fig. 2)

| ROC parameters | Methods |
|---|---|
| ATP quantification | |
| Sensitivity | 57.1% |
| Specificity | 79.8% |
| PPV† | 73.86 |
| NPV‡ | 65.03 |
| Cut-off | ≤20 RLU |
| p-value | 0.112 |
The low sensitivity of the test shows that there is a 57.1% probability of the ATP test assuming the surface as clean, which is really clean (true positive). In contrast, there is a 79.8% probability that the ATP test will assume a surface as dirty when it is really dirty (true negative).
The Positive Predictive Value (PPV) indicates the ability of the ATP test to identify clean surfaces when the result of the ATP test was less than 250 RLU. The negative predictive value (NPV) indicates the ability of the ATP test to identify dirty surfaces when the result of the ATP test was 250 RLU or greater. They are independent values; that is, the PPV is calculated only on the total of clean surfaces and the NPV on the total of dirty surfaces.
Based on this concept, the ATP technique is more likely to identify clean surfaces when the result is less than 250 RLU, since PPV is superior to NPV. According to the ROC analysis, the surfaces would only be considered clean with values below 20 RLU. Values equal to or greater than 20 RLU indicate dirty surfaces.
Regardless of the result of the ROC curve parameters, the analysis was not significant, showing no significant differences in the assessment of surfaces (clean or dirty) when using microbial count or ATP.
4. DISCUSSION
In the literature, there is a study [11] carried out in an emergency service outside the hospital context; this is the first of the authors’ attempt to conduct such study in an emergency room of a hospital. It is essential to highlight that emergency services play a fundamental role in patients’ safety, given that they are often the gateway to the hospital, and in this context, numerous invasive procedures are performed, such as central line placement and at the same time dealing with the challenges of the work process itself: such as the crowding of people, excess of patients and the high proximity of people [21].
4.1. Spearman’s Correlation Between ATP and CFU
Of the 4 surfaces assessed, only the door handle of the women’s bathroom; p= 0.008), showed a significant correlation between the ATP and ACC quantification methods. Similar to what was observed in the study carried out in primary healthcare, of 05 surfaces monitored, only 1 showed a significant correlation between ATP and ACC, with the patient’s bed as the surface (p= 0.001] [22]. In another study carried out in an outpatient clinic, of 5 monitored surfaces, only two showed significant correlation, namely: reception desk (p= 0.002) and hospital bed (p= 0.040] [13]. That is, in all of these cases, the higher the values obtained in the ATP assessment, the greater the ACC.
One of the factors that show little correlation is related to the variation in the results obtained (Table 2). As pointed out in a survey in an Emergency Care Unit (UPA), where it was observed that there was no statistically significant correlation between ACC and ATP, demonstrating that it was not possible to assume that decreasing the ACC will also decrease the ATP values. Also showing a great variation between the correlation results: from -0.611 to 0.905 [11].
4.2. The ROC Curve and Cut-off Values in Other Studies
The ROC curve was also performed in order to verify which quantitative method is the most effective to determine the surface cleaning quality in relation to the CFU gold standard method. It is important to highlight that although visual inspection is widely used by services as a monitoring method and even guided by the National Health Surveillance Agency (ANVISA) (23), as one of the monitoring methods, microbial counting and ATP are methods with greater objectivity.
It is a challenge to standardize the ATP cutoff value for establishing comparisons [13]. Considering ACC as the gold standard in the ROC analysis, variation of the ATP cutoff value is observed in 03 studies of different scenarios. A study [22] carried out in primary healthcare suggested the cut-off point for the ATP below 48 RLU and another study [11] conducted at UPA suggested the ATP cut-off point of 79 RLU. In addition, a survey [13] carried out in an outpatient unit revealed the ATP cut-off point below 49 RLU.
The authors of the study carried out at the outpatient unit [13] suggest a trend in ATP cutoff values below 100 RLU. These findings corroborate the current research carried out in the Emergency Room, where the cut-off point on the ROC curve was obtained with values less than 20 RLU, indicating that the surface is clean.
Several factors can interfere with this variability, mainly in relation to the ATP values. In everything performed in a medical clinic and ICU, it showed a correlation between visual inspection and ATP; however, not absolute, which suggests possible aspects for this, such as inconsistencies in cleaning routines and even the sampling time for collections [24]. There is the need for an adequate time for the action of the chemical [disinfectants] on the surface, as recommended by each manufacturer [25].
The variation in the ATP results could be due to the existence of two systems of quantification of the RLUs by the bioluminescence technique (“Kikkoman ATP device with Lucipak-Pen swabs” and “Hygiena ATP device with Ultrasnap swabs”). In addition, the heterogeneous ability of each evaluator is added during the collection with a swab on the surface [11, 13].
4.3. Historical Series
It is pertinent to point out that the ATP use does not replace the ACC method, as it does not allow the identification of the potential for surface contamination. However, it is a practical tool that allows measuring the effectiveness of CDP with immediate feedback to the team [11]. It is essential that each health service establishes a follow-up with a historical series of its CDP in order to develop subsidies for reference values with a collected database [16, 26].
4.4. Visual Inspection/Physical Defects in the Furniture
As for visual inspection, it appears that its low correlation with ATP; as found in a study [16] carried out in a medical and surgical ward, it was found that the visual assessment did not reflect values with ATP and ACC. It is important to highlight that, as occurred in a study carried out in an outpatient unit [13], the state of conservation of the surface impacts its failure rates, because even when passing through the CDP, of the 4 surfaces monitored, 3 had defects in their structure (scratch and peeling of paint).
4.5. Study Limitations
These include, the choice of only one institution, limited number of areas monitored, and the short follow-up period, both aspects limited by financial issues. The inputs, protocols, sanitizers and equipment used for the research may differ from other studies, which makes comparison difficult.
CONCLUSION
The study brings countless contributions to health professionals, as it makes it possible to evidence criteria for monitoring CDP with objective data beyond the subjectivity of visual inspection. In addition, it is a guide to support the development of institutional protocols, public health policies, both linked to patient safety. In addition, these are the few studies performed in an emergency room, a scenario where numerous invasive procedures are performed.
There is a correlation between the ATP quantification methods and microbial count for the women’s bathroom door handle (women’s = 0.526; P = 0.008). In this study, considering the microbial count as the gold standard on the ROC curve, we suggest ATP equal to or below 20 RLU to classify surfaces as approved in the emergency room. It is essential to use different methods of monitoring the CDP, considering that each method has a different purpose.
ETHICS APPROVAL AND CONSENT TO PARTICIPATE
This study was approved by the Ethics Research Committee of the Federal University of Mato Grosso do Sul, Brazil (Opinion Number: 1,345,888) and its development complied with national and international standards of research ethics.
HUMAN AND ANIMAL RIGHTS
Not applicable.
CONSENT FOR PUBLICATION
Not applicable.
AVAILABILITY OF DATA AND MATERIALS
Not applicable.
FUNDING
Federal University of Mato Grosso do Sul Process: 10-2015.
CONFLICTS OF INTEREST
The authors declare no conflict of interest, financial or otherwise.
ACKNOWLEDGEMENTS
Declared none.