All published articles of this journal are available on ScienceDirect.

Evaluating Health-promoting Lifestyle Profile among Menopausal Women: A Meta-analysis
Authors Info & Affiliations
Abstract
Background:
Menopause is one of the most drastic experiences in a woman's life because of a spectrum of vasomotor symptoms which affect the quality of life and lifestyle. Although many treatments for these symptoms are available, they can be used for only a short duration. The nonpharmacologic therapies associated with healthy lifestyle behaviors are increasing. Health-Promoting Lifestyle Profile- II (HPLP-II), a self-report questionnaire designed to assess an individual's engagement in health-promoting behaviors, has focused on six dimensions of behavioral health promotion. This study aimed to review the degree of lifestyle modification in menopausal women based on the questionnaire HPLP-II.
Methods:
A comprehensive search was conducted for articles using HPLP-II after literature as the identified instrument for menopausal women's lifestyle, followed by a meta-analysis.
Results:
Among 8525 unique titles, 13 studies with 2648 participants were included. Quality assessment was “good” for most of them. The summary effect of participant age was 55.78 years and 49.1 years for menopausal age. Analysis of the pooled studies yielded a mean HPLP total score of 127.69. There was no evidence of publication bias.
Conclusion:
Our meta-analysis showed a moderately rated health-promoting behavioral profile in menopausal women. The spiritual growth subscale received the highest score, whereas physical activity received the lowest score and was at the lower limit of the moderate range. Health policymakers, patients, and healthcare providers can use these results to improve the healthy lifestyles of menopausal women.
1. INTRODUCTION
Menopause is the permanent absence of menstruation caused by the loss of ovarian activity for at least twelve months [1]. Menopause is considered a natural and physiological phenomenon of aging, but is one of the most drastic experiences in a woman's life [2] and occurs on average at age 51, with a range from 45 to 54 years [3]. During menopause, women undergo physiological and psychological changes due to low estrogen levels resulting from a significant decrease in ovarian activity [4]. Physical changes include vasomotor symptoms such as hot flashes and night sweats, weight changes, fatigue, headaches, and vaginal dryness, and various psychological manifestations such as memory loss, anxiety, insomnia, and depression [3]. Depending on the severity, frequency, and extent of these complications and their interference with daily life or occupational tasks, they may not only affect quality of life (QoL) but also be influenced by the lifestyle of the affected person [5].
Many treatments are available to treat menopausal symptoms [5], such as hormone replacement therapy (HRT). However, the use of such treatments must be personalized by weighing the benefits against the existing risks, including vascular events or malignancies of the uterus and breast, and it is therefore recommended that they be used for only a short duration [6]. There is increasing evidence that non- pharmacologic, nonhormonal therapies can relieve the symptoms of menopause [5]. Such treatments focus on controlling food intake, anxiety, and physical activity [2, 7]. More physically active women who participated in Kocak DY et al.'s work suffered less severe menopausal symptoms than participants with a higher body mass index (BMI) who reported more severe complications [4]. Among postmen- opausal women participating in regular aerobic exercise and physical activity programs, the level of FSH was lower and less significant vasomotor symptoms were reported, according to Tartibian et al. findings [8]. Tortumluoglu and Nazari et al. discovered in a study of healthy lifestyle behaviors that menopausal symptoms could be minimized through planned health education for menopausal women [9, 10].
Although the focus on health-promoting lifestyle behaviors to reduce menopausal symptoms is not new in the literature, the assessment of health-promoting behaviors in these women is still controversial. Among all assessment tools, the Health-Promoting Lifestyle Profile- II (HPLP-II) has focused on six critical dimensions of behavioral health promotion. The Health-Promoting Lifestyle Profile (HPLP) is a tool that has been developed for the assessment of an individual's health-promoting behaviors. The HPLP has two versions, namely HPLP-I and HPLP-II. HPLP-I was first introduced in 1987 and comprises 52 items that evaluate six dimensions of spiritual growth (SG), interpersonal relationships (IR), stress management (SM), physical activity (PA), nutrition (N), and health responsibility (HR) [11]. HPLP-II, developed in 1996 as a revised version of HPLP-I, also consists of 52 items and evaluates the same six dimensions but with different item wording and response options [11]. HPLP-II has more positive and specific item wording and response options, making it more sensitive in identifying changes in health-promoting behaviors than HPLP-I. Moreover, HPLP-II has demonstrated higher reliability and validity than HPLP-I, indicating that it is a superior tool for assessing health-promoting behaviors.
The need for a revised tool that could more accurately detect changes in health-promoting behaviors and take into account changes in health behaviors that have occurred since the development of HPLP-I in 1987 led to the introduction of HPLP-II [11]. In conclusion, HPLP-II is considered a better tool for assessing health-promoting behaviors than HPLP-I due to its more sensitive and valid nature, primarily attributable to its positive and specific item wording and response options [11].
Although many articles use the HPLP II to assess health-promoting behaviors in menopausal women or other populations, HPB in menopausal women has not been systematically reviewed based on HPLP II scores. With this in mind, this study aimed to determine the degree of lifestyle modification in menopausal women to alleviate their symptoms based on the results of the questionnaire HPLP-II.
2. METHODS
We conducted this systematic review and meta-analysis following the Preferred Reporting Items for Systematic Reviews and Meta-Analyses (PRISMA) guidelines. Our search strategy and study selection process were based on the PRISMA approach, and we used the PRISMA checklist to ensure that our review adhered to the reporting standards [12].
2.1. Data Sources and Extraction
Relevant studies on health-promoting lifestyle behaviors in menopausal women were found after a literature search of the following bibliographic databases:
Web of Science (Clarivate interface), Medline (PubMed interface), Elsevier's abstract and citation database (Scopus interface), Cochrane (Wiley interface). The search strategy used a combination of health-promoting lifestyle profile keywords and menopause keywords from inception to January 2022, with no language or date restrictions. The keywords for health-promoting lifestyle behaviors were: HPLP, HPLP-II, health-promoting lifestyle profile, health promo*, health program, physical activity, health responsibility, nutrition, interpersonal relationships, stress management, exercise, self-actualization, spiritual growth, and wellness. Key words for menopausal status were: menopause*, postmenopausal*, post menopause*. The full search strategy has been included as supplementary material.
2.2. Eligibility Criteria
We used EndNote 20 (Clarivate Analytics) to screen title, abstract, and full text in 2 separate rounds of shortlisting. Eligible studies were selected based on the principles of Preferred Reporting Items for Systematic Reviews and Meta-Analyzes (PRISMA) [12] by 2 investigators (Z.M and A.M) who performed the screening independently. One of them (A.M) entered the extracted data into an online Google spreadsheet, and the other (Z.M) revisited the spreadsheet. The reviewers had an overall match rate of 89 percent. All discrepancies and inconsistencies were discussed and resolved by revisiting the inclusion or exclusion criteria and reaching consensus.
We included studies with the following criteria for data extraction: i) study participants must be women of menopausal or post-menopausal age. ii) Studies must assess health-promoting lifestyle behaviors using the HPLP II questionnaire. iii) Quantitative data must be reported, including mean and standard deviation of the HPLP II total score or subscale scores.
If an article met the following criteria, we excluded it:
i) Studies did not separately report data on premenopausal and postmenopausal women ii) studies reported the HPLP II questionnaire score but did not report the mean and standard deviation. iii) Observational studies and articles that only contain abstracts of articles presented in congresses. iv) Studies that have examined outcomes other than a healthy lifestyle. v) Studies used the HPLP II for health-promoting behaviors in menopausal women but did not report the data, and the authors did not grant us access to the data when we requested records. vi) Intervention groups of experimental studies (based on different interventions and outcomes).
2.3. Data Analysis
In the third phase, we first extracted or calculated the standard error for each study using the Kaplan-Meier method. We then calculated the pooled means and standard errors (SE) using the generic inverse variance method, in which the weighting of each study is the inverse of the variance of the effect estimate. We also fitted the DerSimonian-Laird [13] random-effects model, which accounts for heterogeneity between studies. We used the Thompson I2 statistic and Cochrane Q to examine heterogeneity, with I2 values of 25%, 50%, and 75% being considered low, moderate, and high heterogeneity, respectively. Forest plots were also created, as multiple factors between studies may have influenced the I2 statistic. Egger regression tests and visual assessment of funnel plots were used to identify potential publication bias. Further investigation of heterogeneity was performed using subgroup analysis stratified by the site to identify the source of heterogeneity.
All statistical analyses were performed using MedCalc statistical software (version 20.027, Medcalc Software Ltd, 2022).
2.4. Quality Assessment
Two independent authors (H.R and S.H) performed the methodological quality (risk of bias) assessment based on the available quality assessment tools developed by NHLBI (14-item checklist for Quality Assessment of Controlled Intervention Studies). Both authors were trained in the use of study-rating instruments. We scored articles with “no” or “cannot determine” or “not applicable” or “not reported” answers zero, whereas a “yes” answer for each question of risk of bias scored 1. Then we categorized articles as “good”(low risk of bias), “fair”(some risk of bias), or “poor” (significant for risk of bias).
3. RESULTS
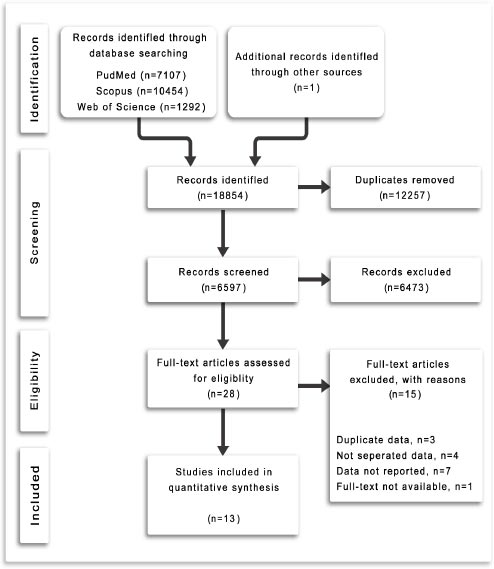
A total of 18853 study records were identified by the electronic search. After removing duplicates, there were a total of 8525 unique titles potentially relevant for inclusion in this review. After reading titles and abstracts and reviewing the full texts of potentially relevant studies, twelve studies (with data from thirteen groups) were included in the final analysis. One additional article was added after a hand search of the reference lists of relevant articles, bringing the total number of included articles to thirteen with a total of 2648 participants. Fig. (1) shows the PRISMA flow diagram illustrating the systematic process of conducting the review.
The 13 included studies were mostly cross-sectional studies (n=7) [14-20], with the remainder being quasi-experimental studies (n=4) [4, 7, 21, 22] and RCT (n=2) [10, 23] published between 2013 and 2021 and included participants from Iran (n=8) [10, 14-16, 18, 20, 22, 23] Sri Lanka (n=2) [19, 21], Korea (n=1) [17], Turkey (n=1) [4], and India (n=1) [7] (Table 1). These studies totally included 2648 participants. The number of participants ranged from 32 to 401, with a median of 141 participants (interquartile range 39-388). Only data from participants in control groups were used in the meta-analysis because participants received different interventions in the different studies. Most studies reported the mean and standard deviation for each subscale of the HPLP II questionnaire, except for one study [7] that reported only the mean and standard deviation of the total score. The study characteristics of the selected studies are shown in Table 1 [24, 25].
| First Author, Year | Country | Design | Size (n) | Age Mean (SD) | Age SE | Menopausal Age Mean (SD) | Menopausal Age SE | Married (n) | Not Married (n)d | Household (n) | Employed/Has Job (n)e |
|---|---|---|---|---|---|---|---|---|---|---|---|
| F. Sehhatie, 2013 | Iran | CSa | 400 | 53.5 (3.5) | 0.18 | 48.4 (2.2) | 0.11 | 363 | 37 | 339 | 161 |
| M. Nazari, 2014 | Iran | RCTb | 100 | N/A | 94 | 6 | 100 | 0 | |||
| F. S. Asrami, 2015 | Iran | CS | 400 | 57.53 (7.63) | 0.38 | 47.78 (5.1) | 0.26 | N/A | 385 | 15 | |
| N. Elahi, 2016 | Iran | CS | 353 | 54.42 (4.3) | 0.23 | N/A | 290 | 63 | |||
| D. Y. Kocak, 2016 | Turkey | QEc | 401 | N/A | |||||||
| J. H. Kim, 2016 | Korea | CS | 140 | 54.98 (4.55) | 0.38 | 49.89 (3.93) | 0.33 | 128 | 12 | N/A | |
| A. Moudi, 2016 | Iran | CS | 262 | 54 (4.88) | 0.3 | 46.86 (3.86) | 0.24 | 1 | 261 | 13 | 249 |
| D. Y. Kocak, 2016 | Turkey | QE | 32 | N/A | 26 | 6 | 31 | 1 | |||
| E. Malik, 2017 | India | QE | 53 | N/A | 46 | 7 | N/A | ||||
| N. Rathnayake, 2017 | Sri Lanka | QE | 35 | 56.5 (3.40) | 0.57 | 49 (4) | 0.68 | 28 | 7 | 28 | 7 |
| R. S. Mousavi, 2018 | Iran | RCT | 33 | 55.67 (4.25) | 0.74 | N/A | 26 | 7 | 27 | 6 | |
| Z. Jalambadani, 2018 | Iran | QE | 52 | 60.35 (3.77) | 0.52 | 51.18 (1.47) | 0.2 | N/A | 39 | 13 | |
| N. Rathnayake, 2019 | Sri Lanka | CS | 245 | 55.9 (3.40) | 0.22 | 50.4 (2.90) | 0.19 | 208 | 37 | 186 | 59 |
| S. Abdolalipour, 2019 | Iran | CS | 142 | 55.4 (3.80) | 0.32 | 49.3 (3.50) | 0.29 | 125 | 17 | 122 | 20 |
| Totalf | 2648 | 55.17 | 0.11 | 49.1 | 0.52 | 1045 | 397 | 1560 | 594 | ||
3.1. Quality Assessment
Based on the NHLBI quality assessment tool for observational cohort and cross-sectional, we detected three cross-sectional studies rated as “good” [14, 16, 20] and two rated as “fair” [15, 18] for risk of bias. Except for one randomized control trial [21], which was rated as “good,” the rest were scored as “fair” for risk of bias, according to the NHLBI instrument for quality assessment of controlled intervention studies. None of the included studies was rated as “poor.” Table 1 in the supplementary material summarizes the quality assessment checklist for each article.
3.2. Assessment of Outcomes
According to our comprehensive systematic review, the summary effect of participant age was 55.78 years (SE 0.53; CI95% 54.742-56.827) and 49.1 years (SE 0.52; CI95% 48.069-50.138) for menopausal age, indicating that most of the included participants were postmenopausal and had passed climacteric period. According to the reported data [15, 23], 51.4% of the women lived in rural areas. Regarding the educational level of the total population, only 22.3% of the participants were illiterate, while 30.1% had an academic degree. For husbands, the proportion was almost the same (20.7% illiterate and 27.8% with academic degrees). 1560 women were housewives, and the rest (644 women; 3 studies did not report employment status) [4, 7, 17] were either employed (self-employed or employed by an organization) or had part-time jobs. This contrasts with their husbands, who were predominantly (94.8%) employed or had a job. Married women accounted for 72.4% of participants; the remainder were widowed, divorced, or never married.
3.3. Meta-analysis
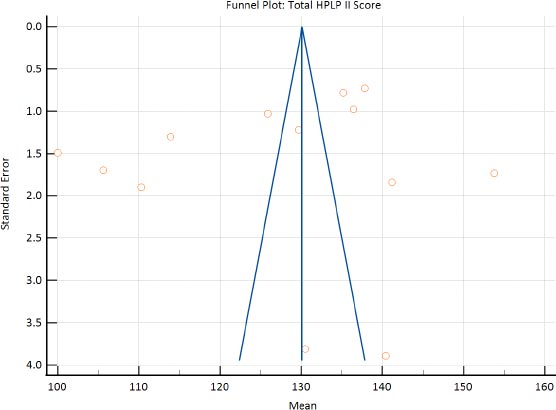
The main findings of each study are summarized in Table 2 and the Supplementary Data. Of the 13 included studies, all but the study by Jalambadani [22] met the inclusion criteria for the meta-analysis assessing the HPLP II total score, and all but Malik’s work [7] were eligible for the meta-analysis assessing the HPLP II subscale scores. Analysis of the pooled studies yielded a mean HPLP total score of 127.69 (SE 3.70; CI95% 120.42-134.95; P < 0.001), which is defined as moderate for the range. Although I2 indicated high heterogeneity between studies, there was no evidence of publication bias. (Egger's test P 0.32)
Pooled analyzes were also performed for the HPLP II subscales and showed no evidence of publication bias (p indicated no statistically significant difference). The pooled mean, SE, CI95%, and p.-value were, respectively, 24.28; 2.24; 19.87 to 28.69; and < 0.001 for the health responsibility subscale, 23.09; 1.087; 20.96 to 25.22; < 0.001 for the interpersonal relationships subscale, 22.46; 0.95; 20.59 to 24.33; < 0.001 for the nutrition subscale, 13.84; 0.54; 12.78 to 14.91; < 0.001 for the physical activity subscale, 25.40; 1.62; 22.21 to 28.59; < 0.001 for the spiritual growth subscale, and 17.30; 0.98; 15.37 to 19.23; < 0.001 for the stress management subscale. Figs. (2 and 3) show funnel and forest plots, respectively.
| First Author, Year | Size (n) | Health Responsibility | Physical Activity | Spiritual Growth | Stress Management | Nutrition | Interpersonal Relationship | Total Score | |||||||
|---|---|---|---|---|---|---|---|---|---|---|---|---|---|---|---|
| Mean (SD) | SE | Mean (SD) | SE | Mean (SD) | SE | Mean (SD) | SE | Mean (SD) | SE | Mean (SD) | SE | Mean (SD) | SE | ||
| F. Sehhatie, 2013 | 400 | 19.80 (3.6) | 0.18 | 12.8 (2.4) | 0.12 | 32.4 (3.6) | 0.18 | 20.8 (4.0) | 0.20 | 23.40 (3.6) | 0.18 | 28.8 (3.6) | 0.18 | 135.20 (15.6) | 0.78 |
| M. Nazari, 2014 | 100 | 30.12 (5.39) | 0.54 | 8.94 (2.44) | 0.24 | 24.33 (5.66) | 0.57 | 10.99 (2.95) | 0.3 | 18.34 (3.00) | 0.3 | 17.58 (4.99) | 0.5 | 110.3 (18.99) | 1.9 |
| F. S. Asrami, 2015 | 400 | 23.57 (4.45) | 0.22 | 16.12 (4.30) | 0.22 | 25.45 (4.46) | 0.22 | 19.59 (3.77) | 0.19 | 25.88 (4.86) | 0.24 | 25.82 (5.02) | 0.25 | 136.43 (19.61) | 0.98 |
| N. Elahi, 2016 | 353 | 40.43 (4.81) | 0.26 | 13.07 (3.37) | 0.18 | 32.55 (5.02) | 0.27 | 12.36 (2.58) | 0.14 | 18.18 (2.74) | 0.15 | 21.19 (3.26) | 0.17 | 137.81 (13.77) | 0.73 |
| D. Y. Kocak, 2016 | 401 | 21.57 (5.45) | 0.27 | 15.05 (5.29) | 0.26 | 25.79 (5.57) | 0.28 | 19.1 (4.84) | 0.24 | 22.22 (4.44) | 0.22 | 25.98 (5.01) | 0.25 | 129.7 (24.38) | 1.22 |
| J. H. Kim, 2016 | 140 | 45.7 (8.65) | 0.73 | 15.21 (3.84) | 0.32 | 34.45 (5.81) | 0.49 | 17.07 (3.05) | 0.26 | 21.93 (3.86) | 0.33 | 19.44 (3.21) | 0.27 | 153.79 (20.50) | 1.73 |
| A. Moudi, 2016 | 262 | 21.3 (4.85) | 0.3 | 14.7 (4.31) | 0.27 | 23.2 (4.07) | 0.25 | 18.5 (3.01) | 0.19 | 24.3 (4.19) | 0.26 | 23.8 (3.80) | 0.23 | 125.9 (16.75) | 1.03 |
| D. Y. Kocak, 2016 | 32 | 21.59(4.41) | 0.78 | 15.97(5.25) | 0.93 | 26.03(5.10) | 0.9 | 18.06(4.38) | 0.77 | 22.53(4.10) | 0.72 | 26.34(4.70) | 0.83 | 130.53(21.53) | 3.81 |
| E. Malik, 2017 | 53 | N/A | 113.90 (9.50) | 1.30 | |||||||||||
| N. Rathnayake, 2017 | 35 | 17.34 (1.78) | 0.3 | 13.08 (1.31) | 0.22 | 18.45 (1.88) | 0.32 | 15.48 (1.61) | 0.27 | 17.91 (1.68) | 0.28 | 17.71 (2.05) | 0.35 | 100 (8.81) | 1.49 |
| R. S. Mousavi, 2018 | 33 | 21.6 (5.4) | 0.94 | 16.0 (4.64) | 0.81 | 26.10 (4.86) | 0.85 | 18.64 (3.52) | 0.61 | 28.89 (3.96) | 0.69 | 25.83 (5.04) | 0.88 | 140.40 (22.36) | 3.89 |
| Z. Jalambadani, 2018 | 52 | 12.44 (3.15) | 0.44 | 11.47 (3.19) | 0.44 | 15.15 (2.44) | 0.34 | 17.12 (9.35) | 1.3 | 21.7 (6.46) | 0.9 | 19 (19.00) | 2.63 | N/A | |
| N. Rathnayake, 2019 | 245 | 17.1 (5.93) | 0.38 | 12.5 (4.35) | 0.28 | 20.42 (4.87) | 0.31 | 16.19 (4.01) | 0.26 | 19.1 (4.99) | 0.32 | 20.23 (4.54) | 0.29 | 105.64 (26.61) | 1.7 |
| S. Abdolalipour, 2019 | 142 | 23.2 (5.90) | 0.5 | 15.8 (5.00) | 0.42 | 26 (4.90) | 0.41 | 21.1 (4.80) | 0.4 | 27.8 (3.80) | 0.32 | 27.4 (4.70) | 0.39 | 141.2 (21.90) | 1.84 |
| Summarya | 2648 | 24.28 | 2.25 | 15.97 | 0.93 | 25.4 | 1.62 | 17.03 | 0.98 | 19.13 | 0.32 | 23.1 | 1.09 | 127.67 | 3.70 |

4. DISCUSSION
Based on the HPLP II questionnaire results, this study evaluated health-promoting behaviors among menopausal women using a systematic review and meta-analysis of 13 studies with 2648 participants. The findings of our meta-analysis indicate a moderately rated health-promoting behavioral profile [10, 18, 19, 21, 22] in menopausal women. The total score HPLP II of 52-90 is considered poor for the range, 91-129 is considered moderate for the range, 130-168 is considered suitable for the range, and 169-208 is considered excellent.
One of the factors that may have contributed to the moderately rated health-promoting behaviors in menopausal women is their socioeconomic, demographic, marital, and cultural status, which varied across the studies included in our meta-analysis. For instance, occupation and marital status were found to have an impact on the physical activity aspect of health-promoting behaviors. Future studies could explore the extent to which these factors influence health-promoting behaviors among menopausal women.
Interestingly, the highest mean score reported was by J. H. Kim in Korea, which suggests that cultural factors could also play a role in health-promoting behaviors among menopausal women. Further research could investigate the impact of cultural factors on health-promoting behaviors among menopausal women, especially in different geographic regions.
The physical activity subscale received the lowest pooled mean score among the 13 grouped subscales analyzed (mean 15.97; SE 0.93), and this finding could be explained by the fact that over 70% of the women included in the studies were married and employed or had part-time jobs, which could affect their physical activity levels. Therefore, interventions that encourage physical activity among menopausal women, such as exercise programs, could be effective in improving their health-promoting behaviors.
In terms of policies or actions, our findings suggest that there is a need for more targeted interventions that promote health-promoting behaviors among menopausal women. For instance, policymakers could consider providing psychological services or creating groups of women who share their experiences to address the unique challenges that menopausal women face. Additionally, more information about the impact of menopause could be provided to women to increase their awareness and understanding of the importance of health-promoting behaviors.
Finally, future research could expand the number of papers to analyze or start a comparative survey that includes developed countries or different clusters of women with different socioeconomic and cultural conditions to gain a better understanding of the factors that influence health-promoting behaviors among menopausal women.
This meta-analysis provides important insights into health-promoting behaviors among menopausal women. The findings suggest that socioeconomic, demographic, marital, and cultural factors could influence these behaviors, and more targeted interventions are needed to improve them. Further research is also required to explore these factors in more detail and to expand the scope of our findings.
5. LIMITATIONS
The overall HPLP score was considered moderate in this study. However, critical study limitations may affect this assessment: First, considerable heterogeneity between studies affected the overall estimate. In addition, the subgroup analysis on the geographic region may limit the interpretations of this study. Evidence of heterogeneity may be based on data or design, including differences in study target populations, respondents' recruitment, administration methods, the timing of outcome measures, or analysis methods. Second, we excluded the intervention groups of the experimental studies to eliminate the effects of different interventions on final outcomes, which could reduce the total number of participants and affect the meta-analysis results. Third, the included studies were of different designs. Even the experimental studies did not have the same design (we included RCTs and quasi-experimental studies), limiting us to a single-group meta-analysis using the generic inverse variance method. Fourth, the health-promoting lifestyle profile presented in our study may be influenced by the countries from which participants originate, most of which are developing countries (with the exception of J. H. Kim's study in Korea). Fifth, although many articles were excluded due to lack of statistical data, many included articles did not report the correlations between health-promoting behaviors and participants' educational, marital, and economic status; family structure; the number of children; and husband's age and education. Sixth, because our study appears to be the first on this topic, the lack of previous similar studies confirming or contradicting our findings made it challenging to evaluate the final estimates. Seventh, despite a comprehensive search strategy with no publication or language restrictions, there is a possibility that we overlooked studies published in a language other than English, in nonindexed journals, or not published at all.
Future studies should focus on ongoing studies based on the results of our meta-analysis to provide a comprehensive review of experimental methods to improve health-promoting behaviors in menopausal women. In addition, studies can compare the outcomes of each health-promoting behavior instrument between developing and developed countries.
CONCLUSION
This study, as one of the first meta-analyses of health-promoting lifestyle behaviors among menopausal women, has provided important findings despite its limitations. Our study showed that health-promoting lifestyle behaviors in menopausal women are at a moderate level based on the HPLP questionnaire. Among the subscales of the questionnaire, spiritual growth received the highest score, whereas physical activity received the lowest score and was at the lower limit of the moderate range. Health policymakers, patients, and healthcare providers can use these results to improve the healthy lifestyles of menopausal women. We deemed it to be necessary to develop a specific instrument to assess health-promoting behaviors.
LIST OF ABBREVIATIONS
| PRISMA | = Preferred Reporting Items for Systematic Reviews and Meta-Analyses |
| HPLP-II | = Health-Promoting Lifestyle Profile- II |
| QoL | = Quality of Life |
CONSENT FOR PUBLICATION
Not applicable.
AVAILABILITY OF DATA AND MATERIAL
All the data and supporting information are provided within the article.
STANDARDS OF REPORTING
PRISMA guidelines were followed in this study.
CONFLICT OF INTEREST
The authors declare no conflict of interest.
FUNDING
There was no external funding source for this study.
ACKNOWLEDGEMENTS
Declared none.
SUPPLEMENTARY MATERIAL
PRISMA checklist is available as supplementary material on the publisher’s website along with the published article.