All published articles of this journal are available on ScienceDirect.

Differences in SBP, BMI, and Stress with AUDIT Score in Adolescents
Abstract
Background:
Consumption of alcohol by adolescents is known to have negative effects on their psychological health (ie.g., depression and stress) and physical health.
Objective:
To investigate factors influencing systolic blood pressure, body mass index, and stress according to Alcohol Use Disorders Identification Test scores among adolescents.
Methods:
This descriptive study included 535 adolescents younger than 20 years who participated in the Sixth National Health and Nutrition Survey conducted in middle and high schools in 2013. Data collected were analyzed using PASW Statistics version 23.0.
Results:
Mean age of these subjects was 15.20 ± 0.08 years. There were 268 (51.0%) male students and 286 (48.6%) middle-school students. Their systolic blood pressure, body mass index, and stress scores were 108.79 ± 0.54 mmHg, 21.22 ± 0.19 kg/m2, and 2.06 ± 0.04, respectively. In low-risk group (Alcohol Use Disorders Identification Test scores ≤ 7), sex (male) and body mass index explained 22.9% of the variance in systolic blood pressure model (Wald F = 35.28, p < 0.001). Systolic blood pressure was the only significant factor influencing body mass index, with an explanatory power of 16.4% (Wald F = 13.91, p < 0.001). Depression was a significant influencing variable for the stress model, with an explanatory power of 15.1% (Wald F = 16.20, p < 0.001). Stress was the only significant factor influencing the body mass index model in the high-risk group (Alcohol Use Disorders Identification Test scores > 7), with the explanatory power of 14.3% (Wald F = 4.14, p = 0.018).
Conclusion:
This study found that systolic blood pressure was an influencing factor of body mass index model in both groups while depression was the main factor influencing stress in low-risk group adolescents.
1. INTRODUCTION
Prevalence rates of lifetime experience of drinking alcohol among male and female adolescent students in 2015 were 46.3% and 34.9%, respectively [1]. The proportion of male studentsdrinking has been similar over the past 3 years while that of female students drinking has tended to decrease. Drinking rate in male students (20.0%) remains higher than that in female students (13.1%) [1]. While fewer adolescents are drinking, alcohol abuse and drinking-behavior problems are increasing [2]. The consumption of alcohol by adolescents is associated with social problems such as maladjustment at school, assaults, theft, and use of medicines that negatively affect physical and cognitive development. This is now recognized as a family and social problem rather than being restricted to an individual [3]. Adolescents are more vulnerable than adults to drinking because they are in a stage of physical growth and physiological development. Alcohol has adverse effects on kidneys, weight growth, and overall health of adolescents due to nutritional imbalance. In addition, it damages organs such as the liver and induces gastrointestinal disorders [2]. It also has negative effects on obesity, metabolic syndrome, hypertension, diabetes, and cardiovascular disease [4].
A previous study has followed up subjects from childhood to adulthood and measured their systolic blood pressure (SBP) and diastolic blood pressure (DBP) [5]. The study found that SBP and DBP showed positive correlations between childhood and early adulthood (with correlation coefficients of 0.53 and 0.45, respectively) [5]. Another study found similar positive correlations of SBP and DBP between adolescence and adulthood [6]. Thus, it is important to identify and prevent risk factors during childhood and adolescence, reduce the prevalence of hypertension in adulthood, and reduce complications caused by hypertension. Body mass index (BMI) can be used as a measure of obesity. It is closely related to metabolic syndrome, a serious social problem associated with an increased risk of all-cause mortality, including mortality due to cardiovascular diseases [7]. More than two-thirds of deaths related to high BMI were due to cardiovascular disease [8]. Moreover, the risk of coronary artery disease increases linearly with BMI [9]. However, studies on hypertension and BMI have mainly focused on adults and elderly people. Few studies have investigated adolescents due to the small number of subjects which makes it necessary to use data that represent the entire population of adolescents.
The consumption of alcohol by adolescents is known to have negative effects on their psychological health (ie.g., depression and stress) and physical health [10]. It also causes social problems [2]. Drinking causes conflict between adolescents and their parents, friends, and teachers. It can induce depression, fear, or aggression that can lead to suicide, juvenile delinquency, or crime [11]. It may also induce social deviation in adolescents [12]. In addition, greater alcohol consumption during adolescence is associated with more problems caused by intemperance and alcohol in adulthood [13]. Adolescents are likely to develop alcohol dependence and addiction more rapidly than adults [11]. Furthermore, drinking can act as a gateway drug to other drugs or delinquency in adolescents [14], hindering their healthy growth and development. It is, therefore, necessary to consider both psychological and physical health of adolescents when studying the effects of drinking. Since adolescents are often exposed to highly stressful situations, it is also necessary to examine factors affecting the association between stress and drinking.
This study involved adolescents younger than 20 years attending middle and high schools who participated in the Sixth National Health and Nutrition Survey (NHNS) in 2013. Their general characteristics and factors related to drinking, physical health, and psychological health were investigated. Relationships among blood pressure, BMI, and stress were also analyzed. Representative sampling was used to obtain findings that might be representative of all adolescents. The aim of this study was to identify factors influencing SBP, BMI, and stress according to Alcohol Use Disorders Identification Test (AUDIT) score group. Concrete objectives of this study were as follows: (1) to measure AUDIT scores in adolescents and identify SBP, BMI, and stress according to AUDIT score group, (2) to determine differences in SBP, BMI, and stress according to general health-related characteristics of adolescents, and (3) to identify the effects of general and health-related characteristics of adolescents on SBP, BMI, and stress according to AUDIT score group. This study distinguished risk groups according to AUDIT scores and constructed SBP, BMI, and stress models. Factors affecting the physical and psychological health of adolescents in relation to drinking were investigated to provide basic data for facilitating health management of adolescents.
2. MATERIALS AND METHODS
2.1. Study Subjects and Data
This study had a descriptive design. Subjects were 535 adolescents younger than 20 years attending middle and high schools who participated in the Sixth NHNS conducted in 2013. The target population of the NHNS is the total Korean population. A two-stage stratified cluster sampling method with first and second extraction units was used. The first extraction unit extracted 576 survey sites based on the first stratification criterion (city or province; neighborhood [dong], town [eup], or township [myeon], and housing type) while the second stratification unit used criteria of residential area ratio and household education ratio to extract 20 households from sample survey sites using a systematic sampling method. In 2013, 3,840 sample households in 192 national sample sites corresponding to one-third of the sample were selected for the survey.
Study subjects were selected from respondents who answered that they were attending middle and high schools among target population of the Sixth NHNS. The required number of samples was calculated using G*Power version 3.1.2 [15]. Based on an effect size (t) of 3, a significance level (α) of 0.05, and a statistical power (1–β) of 90, the total number of samples required was 470 subjects. Thus, 535 subjects were included in the analysis.
2.2. Study tools
2.2.1. General Characteristics of Subjects
General characteristics of subjects analyzed in this study were age, sex, school, BMI, health status, and depression.
2.2.2. Alcohol Use Disorders Identification Test
This study used AUDIT developed by WHO [16]. It consists of 10 questions in three subareas: hazardous alcohol consumption (3 items), alcohol dependence symptoms (3 items), and harmful aspects of alcohol consumption (4 items). Items 1 through 8 were scored on a 5-point scale (0 to 4 points) and items 9 and 10 were scored using three categories (0, 2, and 4 points), with higher summed AUDIT score indicating greater alcohol use disorder. The WHO [16] divides alcohol dependence into four zones based on AUDIT score: Zone 1, scores 0–7 (low-risk alcohol use); Zone II, scores 8–15 (hazardous alcohol use); Zone III, scores 16–19 (bad alcohol use); and Zone IV, score of 20 (harmful alcohol use).
2.2.3. Systolic Blood Pressure
We measured SBP using a standardized manual blood pressure method. The sphygmomanometer was positioned in the middle of the right arm after confirming that the pressure was zero. The right brachial artery was palpated and the middle part of the air pocket was placed over it. Blood pressure was measured after wrapping the pressure band so that the lower part of the pressing band was positioned 3 cm above elbow wrinkles. A binaural stethoscope was used to auscultate Korotkov sounds [17].
The Center for Disease Control introduced a certification system for blood pressure measurements in 2010. To compensate for errors in measuring blood pressure due to noise, temperature, arm height, arm support, and erroneously selected cuffs, we adjusted the height of the arm relative to that of the heart for each subject using multiple 4-cm-high arm rests before measuring blood pressure. The final SBP was measured as a mean of the second and third measurements.
2.2.5. Stress
Stress was assessed using a single item asking about the usual level of stress and scored from 1 point (“I rarely feel stress”) to 4 points (“I feel a lot of stress”) [18].
2.3. Data Collection
Health surveys and screenings of NHNS were conducted at a mobile screening center. Sex, age, subjective health status, education, and economic status were determined in interviews using health questionnaires. Health behaviors related to stress and drinking were investigated by self report. Blood pressure and BMI were measured directly.
2.4. Data Analysis
NHNS samples were extracted using a two stage stratified cluster sampling method rather than simple random sampling and they should be analyzed using a method reflecting this complex sampling design.
Population mean
 and variance
 are estimated as follows:
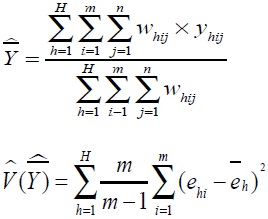 |
where h is floor number, (h = 1, ..., H), i is the number of investigations, (i = 1,...,m), j is the number of subjects (j = 1,...,n), Whij is the weight, Yhij is the collected survey value. Residual value of the corresponding floor/survey site
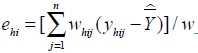 and residual value of the corresponding floor is
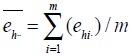 .
.
Data collected were analyzed for floor, cluster, and weight values using PASW Statistics version 23.0 (SPSS, Chicago, IL, USA). Missing data were treated as valid values and were included as analysis variables.
Classifications according to subject characteristics and AUDIT score were performed based on frequency, percentage, mean, and standard-error (SE). Main variables in this study (SBP, BMI, and stress) were summarized as mean and SE values. Differences in SBP, BMI, and stress according to characteristics of subjects were analyzed using a composite-sample linear regression model. Subjects were divided into a low-risk group (AUDIT score up to 7 points) and a high risk group (AUDIT score above 7 points). Relationships among SBP, BMI, stress score, and AUDIT score were analyzed using Pearson’s correlation. Effects of AUDIT score on SBP, BMI, and stress were analyzed using a composite-sample linear regression model. Significance in statistical testing was set at p<0.05.
3. RESULTS
3.1. General Characteristics of Subjects
Mean age of subjects was 15.20±0.08 years, including 311 (65.8%) who were older than 15 years. There were 268 (51.0%) male students and 286 (48.6%) middle-school students. Their health status was 3.76±0.45. Twenty-five (5.7%), 167 (32.9%), and 43 (61.5%) subjects reported having poor, moderate, and good health, respectively. Their BMI was 21.22 ± 0.19 kg/m2 overall: 330 (61.4%) subjects had BMI of 18.5–24.9 kg/m2 while 74 (14.5%) had BMI >25 kg/m2.
All adolescents in this study were classified into Zones I and II: 520 (96.6%) subjects were in WHO Zone 1 (low-risk group) and 56 (10.7%) reported that they felt depressed Table 1.
| Characteristics | Total (n=535) |
AUDIT ≤ 7 (n=520) |
AUDIT > 7 (n=15) |
||||
|---|---|---|---|---|---|---|---|
| N (%) | Mean±SE (range) |
N (%) | Mean±SE | N (%) | Mean±SE | ||
| Age (year) | <15 | 224 (34.2) | 15.20±0.08 | 224 (35.4) | 15.15±0.08 | 0 (0.0) | 16.89±0.27 |
| ≥15 | 311 (65.8) | (12-19) | 296 (64.6) | 15 (100.0) | |||
| Sex | Male | 268 (51.0) | 258 (50.5) | 10 (64.6) | |||
| Female | 267 (49.0) | 262 (49.5) | 5 (35.4) | ||||
| Education | Middle school |
286 (48.6) | 286 (50.3) | 0 (0.0) | |||
| High school |
249 (51.4) | 234 (49.7) | 15 (100.0) | ||||
| Health status | Poor | 25 (5.7) | 3.76±0.45 | 23 (5.3) | 3.77±0.04 | 2 (16.9) | 3.51±0.194 |
| Moderate | 167 (32.9) | (1-5) | 162 (32.7) | 5 (36.1) | |||
| Good | 343 (61.5) | 335 (62.0) | 8 (47.0) | ||||
| BMI (kg/m2) | <18.5 | 131 (24.0) | 21.22±0.19 | 128 (24.3) | 21.18±0.20 | 3 (16.1) | 22.32±1.08 |
| 18.5-24.9 | 330 (61.4) | (14-40) | 320 (61.1) | 10 (71.5) | |||
| ≥25 | 74 (14.5) | 72 (14.6) | 2 (12.4) | ||||
| Depression* | Yes | 56 (10.7) | 52 (10.1) | 4 (31.5) | |||
| No | 470 (87.8) | 459 (89.9) | 11 (68.5) | ||||
| SBP | 108.79±0.54 (84-155) |
108.59±0.55 | 114.53±3.46 | ||||
| BMI | 21.22±0.19 (14-40) |
21.18±0.20 | 22.32±1.08 | ||||
| Stress | 2.06±0.04 (1.0-4.0) |
2.06±0.04 | 2.21±0.14 | ||||
3.2. SBP, BMI, and stress values of subjects
SBP, BMI, and stress score of subjects were 108.79±0.54 mmHg, 21.22±0.19 kg/m2, and 2.06±0.04 points, respectively (range, 84-155 mmHg, 14-40 kg/m2, and 1-4 points, respectively). SBP, BMI, and stress score in the high-risk group were slightly higher than those in the low-risk group, although differences were not significant.
3.3. Differences in SBP, BMI, and stress according to AUDIT score and subject characteristics
Differences in SBP, BMI and stress were analyzed according to general characteristics of low-risk and high-risk groups Table 2. In the low-risk group, SBP was higher in males vs. females (Wald F=33.34, p<0.001) and BMI of 18.5–24.9 and 25 kg/m2 was significantly more common than BMI < 18.5 kg/m2 (Wald F=33.20, p<0.001). BMI was higher in males vs. females (Wald F=6.49, p=0.012) and higher in students without good health status (Wald F=5.59, p=0.005). Stress score differed only in the presence of depression, being higher in students with depression (Wald F=46.45, p<0.001).
| Characteristics | AUDIT: ≤ 7 (n = 520) | ||||||
| SBP | BMI | Stress | |||||
| Mean±SE | Wald F (p) | Mean±SE | Wald F (p) | Mean±SE | Wald F (p) | ||
| Age (year) | <15 | 109.49±1.77 | 0.36 (.547) | 22.32±0.27 | 0.98 (.325) | 2.40±0.10 | 0.15 (.702) |
| ≥15 | 108.68±1.66 | 22.62±0.29 | 2.43±0.10 | ||||
| Sex | Male | 111.83±1.65 | 33.34 (<.001) | 22.67±0.26 | 6.49 (.012) | 2.37±0.10 | 2.36 (.127) |
| Female | 106.34±1.65 | 22.27±0.24 | 2.47±0.10 | ||||
| Education | Middle school | 109.98±1.68 | 1.69 (.196) | 22.54±0.31 | 0.17 (.681) | 2.34±0.10 | 3.36 (.069) |
| High school | 108.20±1.75 | 22.40±0.28 | 2.49±0.10 | ||||
| Health status | Poor | 109.95±2.83 | 0.44 (.645) | 23.14±0.42 | 5.59 (.005) | 2.43±0.21 | 0.01 (.988) |
| Moderate | 108.99±1.42 | 22.34±0.28 | 2.40±0.08 | ||||
| Good | 108.32±1.39 | 21.93±0.23 | 2.41±0.07 | ||||
| BMI (kg/m2) | <18.5 | 103.45±1.75 | 33.20 (<.001) | 17.51±0.22 | 544.66 (<.001) | 2.43±0.10 | 1.03 (.358) |
| 18.5-24.9 | 107.73±1.47 | 21.69±0.23 | 2.36±0.10 | ||||
| ≥25 | 116.08±2.02 | 28.21±0.44 | 2.46±0.11 | ||||
| Depression | Yes | 108.28±1.72 | 1.48 (.232) | 22.16±0.28 | 1.07 (.346) | 2.84±0.14 | 46.45 (<.001) |
| No | 110.60±1.01 | 22.33±0.18 | 2.00±0.07 | ||||
| Characteristics | AUDIT: > 7 (n=15) | ||||||
| SBP | BMI | Stress | |||||
| Mean±SE | Wald F (p) | Mean±SE | V (p) | Mean±SE | Wald F (p) | ||
| Age (year) | <15 | - | - | - | - | - | - |
| ≥15 | 115.77±3.36 | 24.19±0.72 | 2.44±0.11 | ||||
| Sex | Male | 119.91±3.25 | 4.06 (.046) | 24.40±0.84 | 0.30 (.586) | 2.72±0.11 | 3.66 (.058) |
| Female | 111.62±4.52 | 23.98±0.81 | 2.16±0.23 | ||||
| Education | Middle school | - | - | - | - | - | - |
| High school | 115.77±3.36 | 24.19±0.72 | 2.44±0.11 | ||||
| Health status | Poor | 131.14±6.90 | 4.64 (.011) | 24.67±1.44 | 0.53 (.592) | 2.43±0.16 | 0.14 (.867) |
| Moderate | 107.59±5.33 | 23.38±1.09 | 2.38±0.11 | ||||
| Good | 108.56±3.16 | 24.53±0.97 | 2.51±0.20 | ||||
| BMI (kg/m2) | <18.5 | 110.14±4.52 | 1.88 (.157) | 17.85±0.85 | 23.29 (<.001) | 3.04±0.19 | 10.63 (<.001) |
| 18.5-24.9 | 119.52±3.77 | 21.86±0.74 | 2.12±0.10 | ||||
| ≥25 | 117.64±8.05 | 32.85±2.04 | 2.16±0.16 | ||||
| Depression | Yes | 117.68±5.02 | 0.73 (.395) | 24.92±0.96 | 2.96 (.088) | 2.86±0.19 | 9.30 (.003) |
| No | 113.85±2.72 | 23.46±0.69 | 2.03±0.16 | ||||
The high-risk group only contained high-school students older than 15 years. SBP was higher in males than females (Wald F=4.06, p=0.046) and higher in students with good or normal health status than in those with poor health status (131.14±6.90 mmHg) (Wald F=4.64, p=0.011). The stress score was significantly higher in those with BMI below 18.5 kg/m2 than in those with BMI of 18.5–24.9 and 25 kg/m2 (Wald F=10.63, p<0.001). Stress was higher in students with depression than in those without depression (Wald F=9.30, p=0.003).
3.4. Correlations Among SBP, BMI, and Stress
SBP showed a moderate positive correlation with BMI (r=0.36, p<0.001) in the low-risk group. Other variables showed no significant correlations Table 3.
| Variable | AUDIT ≤ 7 (n=520) | AUDIT > 7 (n=15) | ||
|---|---|---|---|---|
| SBP | BMI | SBP | BMI | |
| SBP | 1 | 1 | ||
| BMI | .36 (<.001) | 1 | .38 (.164) | 1 |
| Stress | .03 (.520) | .06 (.188) | -.10 (.717) | -.27 (.330) |
3.5. Effects of AUDIT Score on SBP, BMI, and Stress
To identify factors affecting SBP, BMI, and stress as dependent variables, categorical variables that differed significantly among the general characteristics were included as dummy variables. Other dependent variables besides health status and model-dependent variables were entered as continuous variables. A regression model was constructed for each dependent variable using a composite linear model.
Variables affecting SBP in the low risk group were sex and BMI. They also differed in univariate analysis. The explanatory power of the model that combined stress with these two variables was 22.9% (Wald F=35.28, p<0.001). Variables affecting SBP in the high-risk group were sex and health status that also differed in univariate analysis. However, neither variable had significance in the combined model with BMI and stress. The explanatory power of the model was 28.1% (Wald F=7.31, p<0.001).
Variables affecting BMI in the low risk group were sex and health status that also differed in univariate analysis. In the model that combined SBP and stress, SBP was the only significant variable, with an explanatory power of 16.4% (Wald F=13.91, p<0.001). Stress was the only significant factor influencing BMI of the high-risk group. Explanatory power of this model was 14.3% (Wald F=4.14, p=0.018).
The variable that affected stress in the low risk group was depression which also differed in univariate analysis. In the model that combined SBP and BMI, depression was a significant variable. Explanatory power of the model was 15.1% (Wald F=16.20, p<0.001). Depression affected stress in the high-risk group. The model that combined SBP and BMI did not have any significant variable. The model itself was not significant (Wald F=0.81, p=0.489) Table 4.
| Variable | AUDIT: ≤ 7 (n=520) | ||||||||
|---|---|---|---|---|---|---|---|---|---|
| SBP | BMI | Stress | |||||||
| B | SE | t (p) | B | SE | t (p) | B | SE | t (p) | |
| Intercept | 84.22 | 2.79 | 30.19 (<.001) | 6.11 | 2.30 | 2.66 (.009) | 1.62 | 0.31 | 5.28 (<.001) |
| Sex (ref=Female) | |||||||||
| Male | 5.54 | 1.01 | 5.48 (<.001) | -0.20 | 0.34 | -0.59 (.554) | |||
| Depression (ref=No) | |||||||||
| Yes | 0.88 | 0.13 | 6.96 (<.001) | ||||||
| Health status | -0.34 | 0.25 | -1.38 (.169) | ||||||
| SBP | 0.15 | 0.02 | 7.45 (<.001) | 0.00 | 0.00 | 0.69 (.493) | |||
| BMI | 0.99 | 0.14 | 7.22 (<.001) | 0.00 | 0.00 | 0.62 (.539) | |||
| Stress | 0.29 | 0.68 | 0.42 (.677) | 0.15 | 0.25 | 0.60 (.552) | |||
| Wald F (p) | 35.28 (<.001) | 13.91 (<.001) | 16.20 (<.001) | ||||||
| R2 | .229 | .164 | .151 | ||||||
| Variable | AUDIT: > 7 (n=15) | ||||||||
| SBP | BMI | Stress | |||||||
| B | SE | t (p) | B | SE | t (p) | B | SE | t (p) | |
| Intercept | 125.92 | 37.93 | 3.32 (.001) | 17.46 | 8.85 | 1.97 (.051) | 2.62 | 0.99 | 2.64 (.009) |
| Sex (ref=Female) | |||||||||
| Male | 12.50 | 8.40 | 1.49 (.139) | ||||||
| Depression (ref=No) | |||||||||
| Yes | 0.41 | 0.38 | 1.06 (.292) | ||||||
| Health status | -4.71 | 4.46 | -1.06 (.293) | ||||||
| SBP | 0.08 | 0.09 | 0.89 (.373) | 0.00 | 0.00 | 0.26 (.799) | |||
| BMI | 0.11 | 0.92 | 0.11 (.909) | -0.04 | 0.03 | -1.23 (.220) | |||
| Stress | -2.39 | 4.19 | -0.57 (.569) | -1.80 | 0.62 | -2.89 (.005) | |||
| Wald F (p) | 7.31 (<.001) | 4.14 (.018) | 0.81 (.489) | ||||||
| R2 | .281 | .143 | .165 | ||||||
4. DISCUSSION
This study examined SBP, BMI, and stress level according to AUDIT scores based on the Sixth NHNS conducted in 2013. It investigated how these variables differed according to general health related characteristics by taxonomic group. In the low risk group (AUDIT score ≤ 7), SBP was significantly higher in males when BMI was >18.5 kg/m2. This result is consistent with a previous report on sex and obesity being risk factors for hypertension [19]. In the present high-risk group (AUDIT score > 7), SBP was significantly higher when the health status was poor than that when the health status was better than moderate. SBP in the high-risk group was 131.14±6.90 mmHg, higher than the overall SBP of 108.79±0.54 mmHg. The seventh report from the Joint National Committee of the National Institutes of Health defines hypertension as a blood pressure of >140/90 mmHg and a high risk of hypertension of >130/80 mmHg [20]. Considering that the risk of cardiovascular disease reportedly doubles for each increase of 20 mmHg in SBP and 10 mmHg in DBP, for blood pressures of >115/75 mmHg [20], and that hypertension and ischemic heart disease contribute to 35% and 21% of cerebrovascular diseases, respectively, in Korea [21], it is necessary to pay attention to blood pressure and cardiovascular disease in subjects with a high risk of alcohol disorder and poor health status. The likelihood of developing hypertension is 2.5-fold higher among adolescents with blood pressure higher than the 90th percentile [22]. The occurrence of hypertension in children and adolescents increases the duration of hypertension in the life cycle and the incidence of complications [22]. Blood pressure should therefore be continuously monitored and managed in high-risk adolescents.
While BMI was found to be high in males and that their self-reported health status was poor in the low risk group, BMI was not related to sex or health status in the high-risk group. Alcohol has a high calorific content. It is less likely to be converted into fat in the body. However, it stimulates appetite, increases food intake, and prevents fat oxidation, thereby increasing the accumulation of body fat. Alcohol may increase the risk of abdominal obesity [4]. Nutritional imbalance due to alcohol intake may also have negative effects on growth such as height and weight [2]. These factors could explain inconsistent relationships of variables in the present study with BMI.
In the low risk group, stress differed significantly only with depression, being high in the presence of depression, consistent with previous findings [10]. In the high-risk group, stress was significantly higher in subjects with BMI <18.5 kg/m2 than those with BMI ≥ 18.5 kg/m2, consistent with a previous report [4]. The stress score was higher in students with depression regardless of their risk of alcohol use disorder.
Classifying and constructing SBP, BMI, and stress models according to AUDIT score revealed that sex and BMI significantly affected SBP in the low risk group, with an explanatory power of 22.9%, consistent with previous studies [23, 24]. In the present high-risk group, the model with sex, health status, BMI, and stress (which differed in the univariate analysis) had an explanatory power of 28.1%. Each variable had no significant effect. Results of this study on the relationship between sex and BMI from the SBP model in the low risk group were consistent with those of previous studies [23, 24]. However, none of these variables had a significant effect in the high-risk group, indicating that alcohol could influence relationships among sex, BMI, and blood pressure. In high-risk individuals, blood pressure may be high even if BMI is not high. This suggests that alcohol is involved in blood-pressure related mechanisms such as sympathetic nervous system, stimulation of renin-angiotensin system and cortisol, and inhibition of vasodilation [25].
In the low risk group, the explanatory power of the resulting model combining SBP and stress was 16.4%, with SBP being the only significant influencing variable. This result is consistent with previous study [23] showing a positive correlation between blood pressure and BMI. No general characteristics affected BMI in adolescents in the high-risk group. Explanatory power of the model combining SBP and stress was 14.3%. Stress was the only significant influencing variable. Stress did not affect BMI in the low risk group, although higher stress was associated with lower BMI in the high-risk group, indicating that psychological factors such as stress could affect physical factors such as BMI, supporting a previous report [4].
For the low-risk group, when depression, SBP, and BMI (which differed in the univariate analysis) were entered in the stress model, the explanatory power was 15.1% and depression was a significant influencing variable, consistent with a previous report [10]. In contrast, in the model with depression, SBP or BMI was not significant in the high-risk group. There were no significant influencing variables, suggesting that the relationship between AUDIT score and stress was complex in high-risk individuals showing different characteristics in relation to depression and stress. Higher stress generally makes drinking behaviors more likely as a means of relieving stress [26]. However, the causality of the relationship between drinking behavior and high stress remains unclear [27]. Alcohol is often consumed to relieve stress and avoid reactions as a countermeasure to mitigate and cope with stress [28]. Since the effect of stress and its explanatory power is not very high [29], it is difficult to see how drinking will relieve stress by itself, consistent with the present study finding that stress has a strong influence on drinking in the high-risk group.
This study constructed SBP, BMI, and stress models to investigate factors affecting SBP and BMI known to be closely related to physical health and factors affecting stress (i.e., psychological health). Since alcohol exerts various effects on physical and psychological health, models were constructed by dividing subjects into low and high-risk groups based on AUDIT score. A total of 520 of 535 subjects were in the low-risk group. Significant variables differed in the high risk group, although the model itself was not significant. Fifteen subjects included in that group might have been too few to reveal significant differences. However, significant difference between the low- and high-risk groups in univariate analysis indicated distinctive intergroup characteristics, suggesting that different approaches might be needed for each group.
Since metabolic syndrome and various cardiovascular diseases are no longer confined to adulthood, prevention and management are necessary from the adolescence period [30]. Thus, factors relevant to adolescents need to be identified. Correcting undesirable habits or behaviors in adolescents that are closely related to adulthood can help them develop health-promoting behaviors. This is crucial for their lifelong health. Therefore, it is imperative to develop relevant education and intervention programs. In particular, it is necessary to develop and apply different intervention programs for people with different drinking risks by identifying factors affecting each AUDIT risk group.
CONCLUSION
This study investigated AUDIT scores in adolescents based on NHNS performed in 2013 to determine how SBP, BMI, and stress differed with AUDIT scores. Exploring differences in SBP, BMI, and stress according to general and health related characteristics of subjects revealed that diverse variables affected these parameters. In addition, modeling according to AUDIT score revealed variations in influencing variables. Explanatory power also varied depending on the risk of alcohol use disorder. The influence of different variables on SBP, BMI, and stress implies that AUDIT score can reflect effects of general characteristics on blood pressure and stress. Hence, customized interventions are needed.
This study performed an analysis using a composite-sample design with data from the Sixth NHNS. Its findings should be generalizable. Results of this study are meaningful in that it is focused on how physical and psychological health of adolescents affects adulthood health. In addition, since blood pressure and stress were examined together, influences of cardiovascular disease and psychological health might vary according to AUDIT score. Our modeling revealed variations in influencing factors and their degrees of influence, demonstrating the need to customize interventions. However, typical characteristics of adolescents revealed that there were few subjects in the high-risk group. This restricted the ability to reveal significant differences.
ETHICS APPROVAL AND CONSENT TO PARTICIPATE
Korea Centers for Disease Control and Prevention Institutional Review Board (ethical review committee for health survey data) approved the study protocol(IRB No 2013-07CON-03-4C).
HUMAN AND ANIMAL RIGHTS
No Animals were used in this research. All human research procedures followed were in accordance with the ethical standards of the committee responsible for human experimentation (institutional and national), and with the Helsinki Declaration of 1975, as revised in 2013.
CONSENT FOR PUBLICATION
Informed consent have been obtained.
CONFLICT OF INTEREST
The authors declare no conflict of interest, financial or otherwise.
ACKNOWLEDGEMENTS
We are grateful to all the study’s participants. This work was supported by the research grant of the Chungbuk National University in 2018. This study was conducted with financial support from the Korea Centers for Disease Control and Prevention [KCDC] in 2016.